33
/es/
AIzaSyAYiBZKx7MnpbEhh9jyipgxe19OcubqV5w
August 1, 2025
219877
Papua New Guinea
PNG
true
2
1
Natural gas rents (% of GDP)
2015,2014,2013,2012,2011,2010,2009,2008,2007,2006,2005,2004,2003,2002,2001,2000,1999,1998,1997,1996,1995,1994,1993,1992
Download
Estadísticas Globales de la Biblioteca →Papua New Guinea →

Natural gas rents (% of GDP)

Estas estadísticas en otros países:

AfghanistanAlbaniaAlgeriaAngolaArab WorldArgentinaArmeniaAustraliaAustriaAzerbaijanBahrainBangladeshBarbadosBelarusBelgiumBelizeBeninBoliviaBosnia and HerzegovinaBotswanaBrazilBrunei DarussalamBulgariaCambodiaCameroonCanadaCaribbean small statesCentral Europe and the BalticsChadChileChinaColombiaCongo, Dem. Rep.Congo, Rep.Costa RicaCote d'IvoireCroatiaCubaCyprusCzech RepublicDenmarkDominican RepublicEarly-demographic dividendEast Asia & PacificEast Asia & Pacific (excluding high income)East Asia & Pacific (IDA & IBRD countries)EcuadorEgypt, Arab Rep.El SalvadorEquatorial GuineaEritreaEstoniaEthiopiaEuro areaEurope & Central AsiaEurope & Central Asia (excluding high income)Europe & Central Asia (IDA & IBRD countries)European UnionFinlandFragile and conflict affected situationsFranceGabonGeorgiaGermanyGhanaGreeceGuatemalaHaitiHeavily indebted poor countries (HIPC)High incomeHondurasHungaryIBRD onlyIcelandIDA & IBRD totalIDA blendIDA onlyIDA totalIndiaIndonesiaIran, Islamic Rep.IraqIrelandIsraelItalyJamaicaJapanJordanKazakhstanKenyaKorea, Rep.KosovoKuwaitKyrgyz RepublicLate-demographic dividendLatin America & Caribbean Latin America & Caribbean (excluding high income)Latin America & the Caribbean (IDA & IBRD countries)LatviaLeast developed countries: UN classificationLebanonLibyaLithuaniaLow & middle incomeLow incomeLower middle incomeLuxembourgMacedonia, FYRMalaysiaMaltaMauritiusMexicoMiddle East & North AfricaMiddle East & North Africa (excluding high income)Middle East & North Africa (IDA & IBRD countries)Middle incomeMoldovaMongoliaMontenegroMoroccoMozambiqueMyanmarNamibiaNepalNetherlandsNew ZealandNicaraguaNigerNigeriaNorth AmericaNorwayOECD membersOmanOther small statesPakistanPanamaPapua New GuineaParaguayPeruPhilippinesPolandPortugalPost-demographic dividendPre-demographic dividendQatarRomaniaRussian FederationSaudi ArabiaSenegalSerbiaSingaporeSlovak RepublicSloveniaSmall statesSouth AfricaSouth AsiaSouth Asia (IDA & IBRD)South SudanSpainSri LankaSub-Saharan Africa Sub-Saharan Africa (excluding high income)Sub-Saharan Africa (IDA & IBRD countries)SudanSwedenSwitzerlandSyrian Arab RepublicTajikistanTanzaniaThailandTimor-LesteTogoTrinidad and TobagoTunisiaTurkeyTurkmenistanUkraineUnited Arab EmiratesUnited KingdomUnited StatesUpper middle incomeUruguayUzbekistanVenezuela, RBVietnamWest Bank and GazaWorldYemen, Rep.ZambiaZimbabwe

línea de tiempo (timeline):

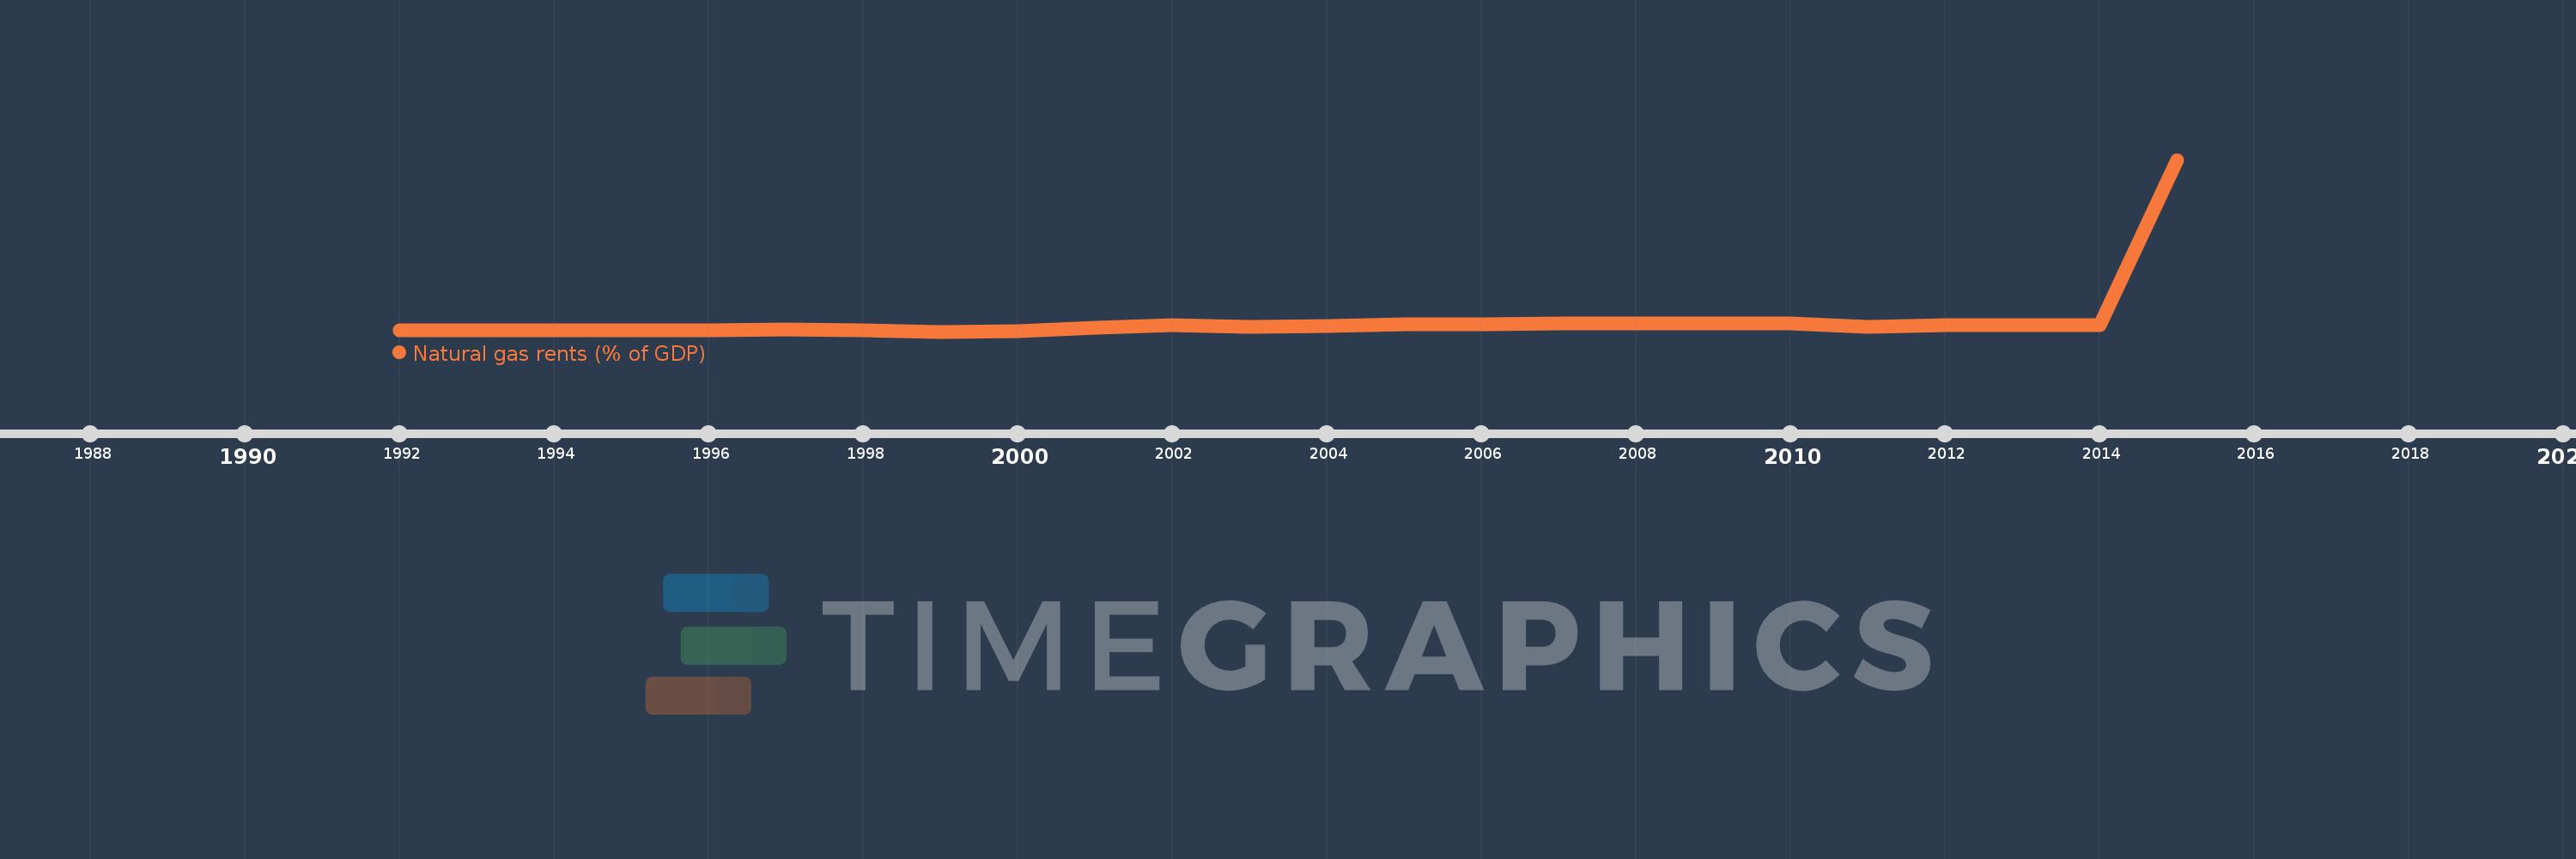
En esta escala de tiempo se presenta un gráfico de 1992 y 2015 de Papua New Guinea. Los datos de 1991 están ausentes. El número de observaciones reales por fecha: 24.

Fuente (nombre):

Indicadores del desarrollo mundial

Fuente (organización):

Estimates based on sources and methods described in "The Changing Wealth of Nations: Measuring Sustainable Development in the New Millennium" (World Bank, 2011).

Categorías:

Energy & Mining, Environment

Se ha actualizado:

23 abr 2017 año

Los indicadores de los cambios de valor en los últimos años

En promedio:
0.105
Mínimo:
0.003
1 ene 1999 año
Máximo:
1.533
1 ene 2015 año
A la fecha de observación
Valor
Cambio absoluto
El cambio con respecto al valor anterior
1 ene 1992 año
0.015
+0.015
0.0%
1 ene 1993 año
0.011
-0.004
-26.81%
1 ene 1994 año
0.015
+0.004
39.51%
1 ene 1995 año
0.018
+0.003
17.57%
1 ene 1996 año
0.017
0.0
-2.76%
1 ene 1997 año
0.02
+0.003
17.5%
1 ene 1998 año
0.017
-0.003
-14.34%
1 ene 1999 año
0.003
-0.014
-80.91%
1 ene 2000 año
0.008
+0.005
140.77%
1 ene 2001 año
0.041
+0.034
425.6%
1 ene 2002 año
0.058
+0.016
39.6%
1 ene 2003 año
0.043
-0.015
-25.59%
1 ene 2004 año
0.055
+0.012
28.54%
1 ene 2005 año
0.071
+0.015
27.65%
1 ene 2006 año
0.067
-0.004
-5.39%
1 ene 2007 año
0.073
+0.006
9.55%
1 ene 2008 año
0.073
0.0
-0.68%
1 ene 2009 año
0.078
+0.005
7.49%
1 ene 2010 año
0.079
+0.0
0.53%
1 ene 2011 año
0.044
-0.035
-44.32%
1 ene 2012 año
0.064
+0.02
45.74%
1 ene 2013 año
0.064
+0.0
0.7%
1 ene 2014 año
0.059
-0.006
-8.83%
1 ene 2015 año
1.533
+1.475
2.52 mil%

Ranking de los países por los datos estadísticos actuales