33
/es/
AIzaSyB4mHJ5NPEv-XzF7P6NDYXjlkCWaeKw5bc
November 1, 2025
249217
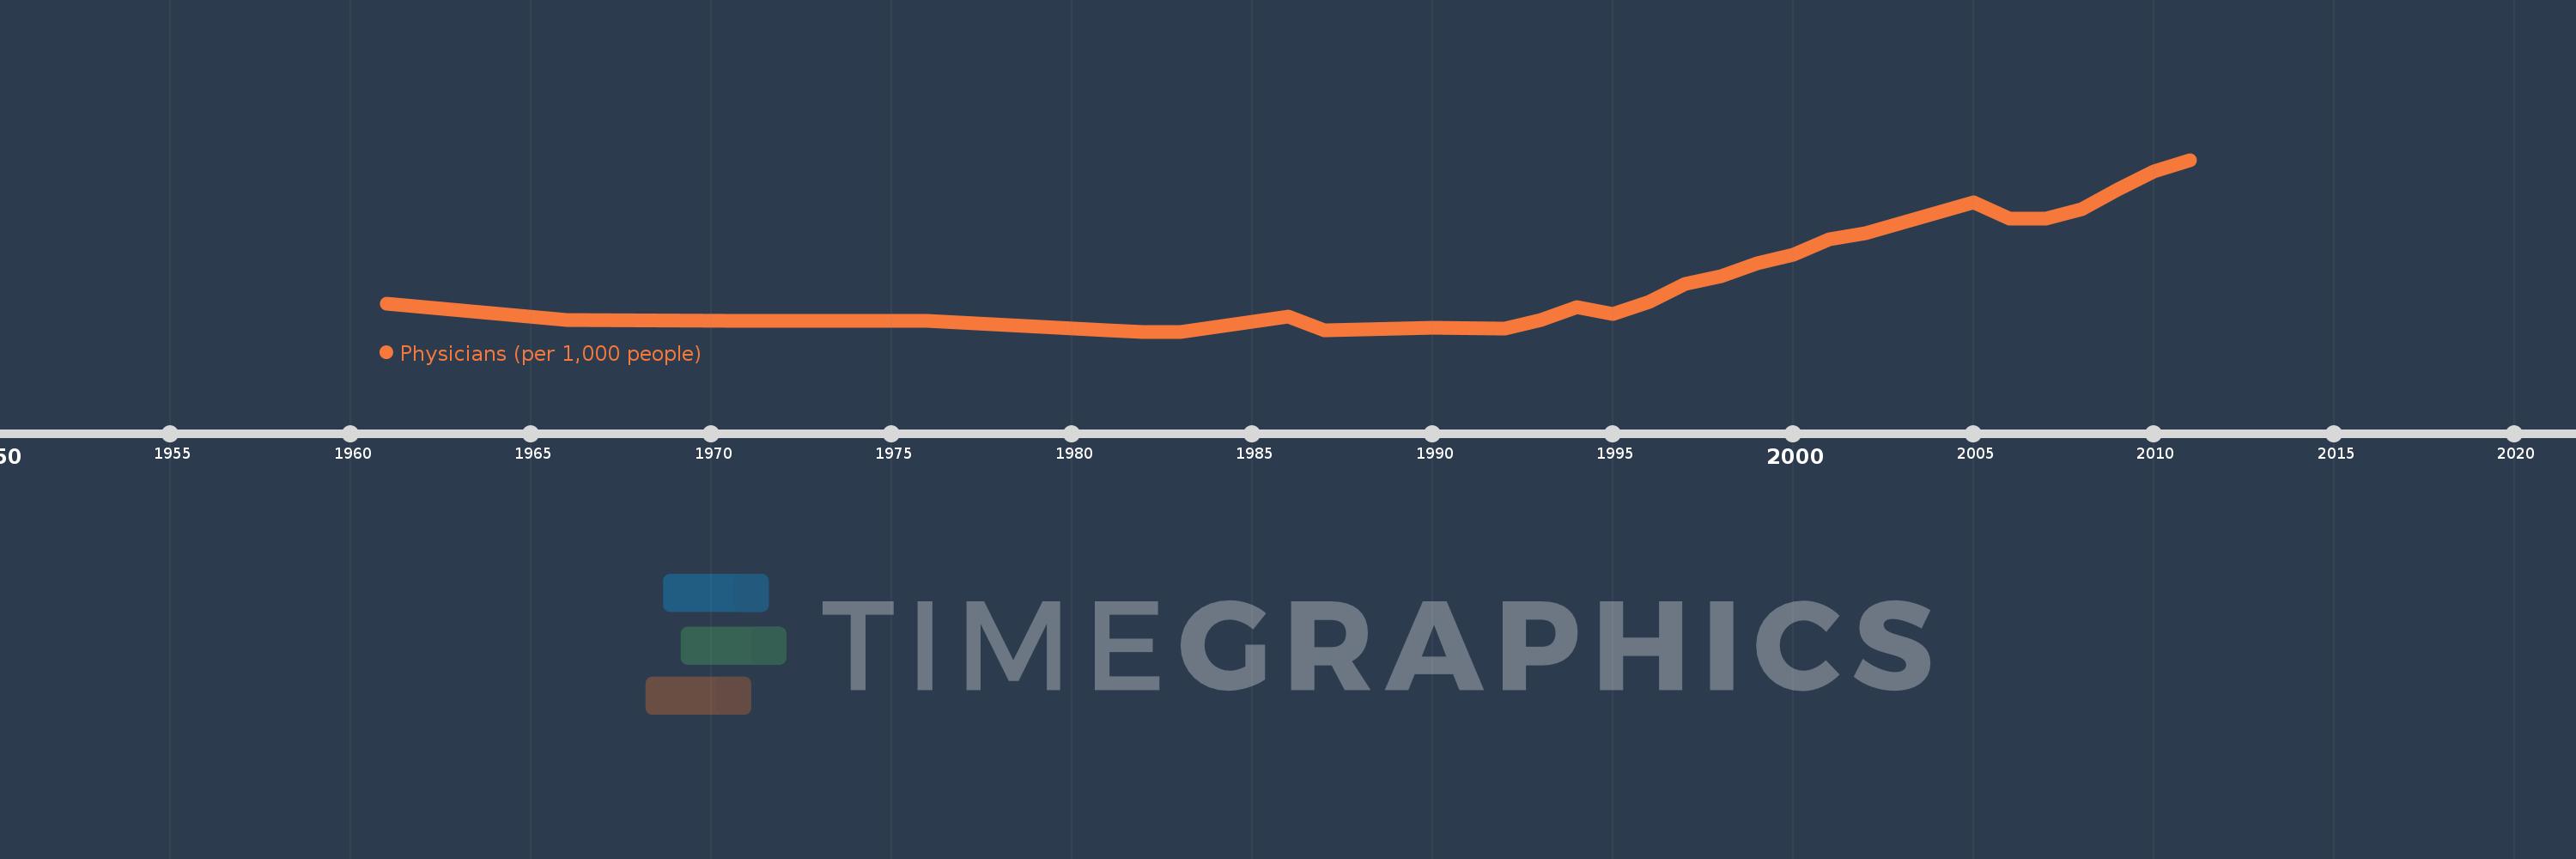
Sri Lanka
LKA
true
2
1
Physicians (per 1,000 people)
2011,2010,2009,2008,2007,2006,2005,2002,2001,2000,1999,1998,1997,1996,1995,1994,1993,1992,1990,1987,1986,1983,1982,1981,1976,1971,1966,1961