33
/es/
AIzaSyAYiBZKx7MnpbEhh9jyipgxe19OcubqV5w
August 1, 2025
155094
India
IND
true
2
1
Physicians (per 1,000 people)
2013,2012,2011,2010,2009,2008,2007,2006,2005,2004,2003,2002,2001,1999,1994,1993,1992,1989,1985,1982,1981,1976,1971,1966,1961
Download
Estadísticas Globales de la Biblioteca →India →

Physicians (per 1,000 people)

Estas estadísticas en otros países:

AfghanistanAlbaniaAlgeriaAmerican SamoaAndorraAngolaAntigua and BarbudaArab WorldArgentinaArmeniaArubaAustraliaAustriaAzerbaijanBahamas, TheBahrainBangladeshBarbadosBelarusBelgiumBelizeBeninBermudaBhutanBoliviaBosnia and HerzegovinaBotswanaBrazilBrunei DarussalamBulgariaBurkina FasoBurundiCabo VerdeCambodiaCameroonCanadaCaribbean small statesCayman IslandsCentral African RepublicCentral Europe and the BalticsChadChannel IslandsChileChinaColombiaComorosCongo, Dem. Rep.Congo, Rep.Costa RicaCote d'IvoireCroatiaCubaCyprusCzech RepublicDenmarkDjiboutiDominicaDominican RepublicEarly-demographic dividendEast Asia & PacificEast Asia & Pacific (excluding high income)East Asia & Pacific (IDA & IBRD countries)EcuadorEgypt, Arab Rep.El SalvadorEquatorial GuineaEritreaEstoniaEthiopiaEuro areaEurope & Central AsiaEurope & Central Asia (excluding high income)Europe & Central Asia (IDA & IBRD countries)European UnionFijiFinlandFragile and conflict affected situationsFranceFrench PolynesiaGabonGambia, TheGeorgiaGermanyGhanaGreeceGreenlandGrenadaGuamGuatemalaGuineaGuinea-BissauGuyanaHaitiHeavily indebted poor countries (HIPC)High incomeHondurasHong Kong SAR, ChinaHungaryIBRD onlyIcelandIDA & IBRD totalIDA blendIDA onlyIDA totalIndiaIndonesiaIran, Islamic Rep.IraqIrelandIsraelItalyJamaicaJapanJordanKazakhstanKenyaKiribatiKorea, Dem. People’s Rep.Korea, Rep.KuwaitKyrgyz RepublicLao PDRLate-demographic dividendLatin America & Caribbean Latin America & Caribbean (excluding high income)Latin America & the Caribbean (IDA & IBRD countries)LatviaLeast developed countries: UN classificationLebanonLesothoLiberiaLibyaLithuaniaLow & middle incomeLow incomeLower middle incomeLuxembourgMacao SAR, ChinaMacedonia, FYRMadagascarMalawiMalaysiaMaldivesMaliMaltaMarshall IslandsMauritaniaMauritiusMexicoMicronesia, Fed. Sts.Middle East & North AfricaMiddle East & North Africa (excluding high income)Middle East & North Africa (IDA & IBRD countries)Middle incomeMoldovaMonacoMongoliaMontenegroMoroccoMozambiqueMyanmarNamibiaNauruNepalNetherlandsNew CaledoniaNew ZealandNicaraguaNigerNigeriaNorth AmericaNorthern Mariana IslandsNorwayOECD membersOmanOther small statesPacific island small statesPakistanPalauPanamaPapua New GuineaParaguayPeruPhilippinesPolandPortugalPost-demographic dividendPre-demographic dividendPuerto RicoQatarRomaniaRussian FederationRwandaSamoaSan MarinoSao Tome and PrincipeSaudi ArabiaSenegalSerbiaSeychellesSierra LeoneSingaporeSlovak RepublicSloveniaSmall statesSolomon IslandsSomaliaSouth AfricaSouth AsiaSouth Asia (IDA & IBRD)SpainSri LankaSt. Kitts and NevisSt. LuciaSt. Vincent and the GrenadinesSub-Saharan Africa Sub-Saharan Africa (excluding high income)Sub-Saharan Africa (IDA & IBRD countries)SudanSurinameSwazilandSwedenSwitzerlandSyrian Arab RepublicTajikistanTanzaniaThailandTimor-LesteTogoTongaTrinidad and TobagoTunisiaTurkeyTurkmenistanTuvaluUgandaUkraineUnited Arab EmiratesUnited KingdomUnited StatesUpper middle incomeUruguayUzbekistanVanuatuVenezuela, RBVietnamVirgin Islands (U.S.)West Bank and GazaWorldYemen, Rep.ZambiaZimbabwe

línea de tiempo (timeline):

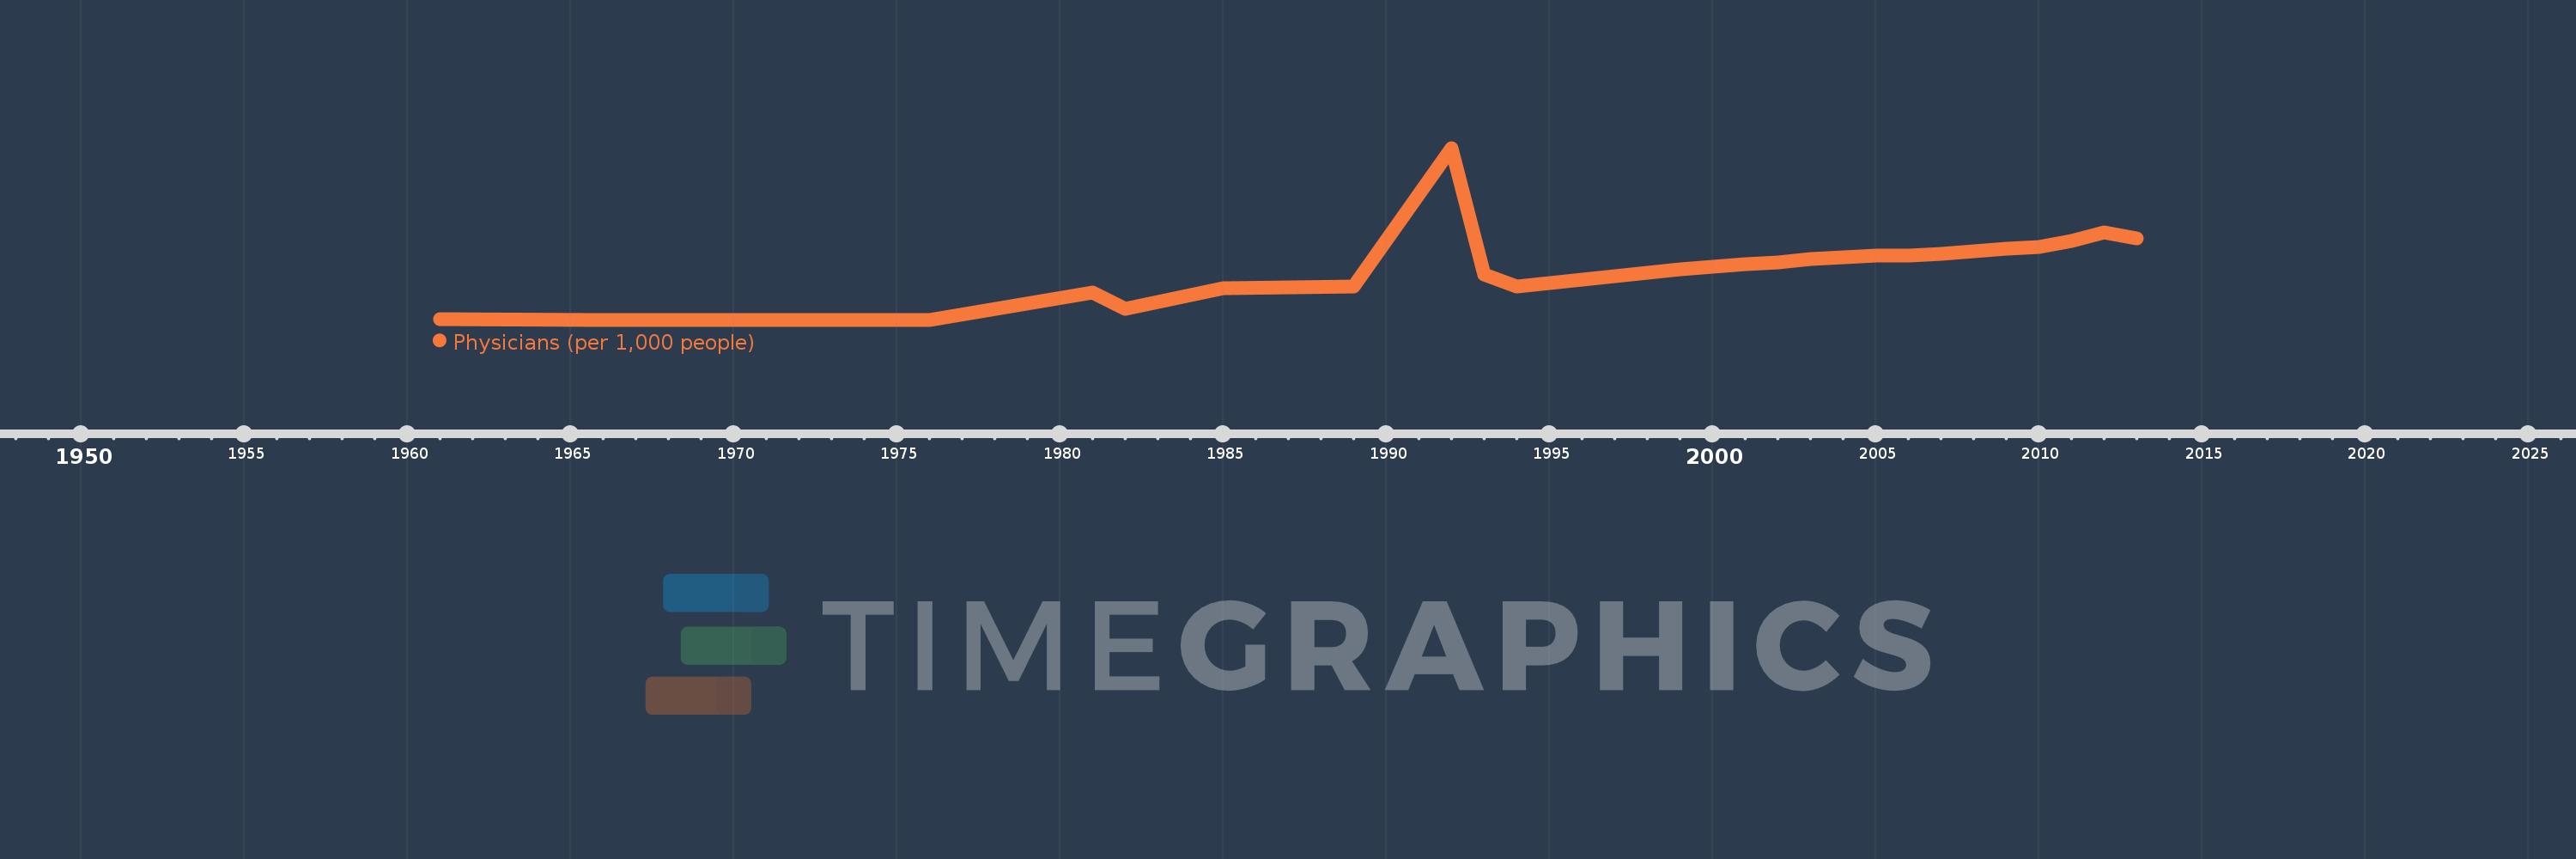
En esta escala de tiempo se presenta un gráfico de 1961 y 2013 de India. Los datos de 1960 están ausentes. El número de observaciones reales por fecha: 25.

Fuente (nombre):

Indicadores del desarrollo mundial

Fuente (organización):

World Health Organization's Global Health Workforce Statistics, OECD, supplemented by country data.

Categorías:

Health

Se ha actualizado:

23 abr 2017 año

Los indicadores de los cambios de valor en los últimos años

En promedio:
0.522
Mínimo:
0.204
1 ene 1976 año
Máximo:
1.26
1 ene 1992 año
A la fecha de observación
Valor
Cambio absoluto
El cambio con respecto al valor anterior
1 ene 1961 año
0.21
+0.21
0.0%
1 ene 1966 año
0.205
-0.006
-2.64%
1 ene 1971 año
0.205
0.0
-0.2%
1 ene 1976 año
0.204
0.0
-0.2%
1 ene 1981 año
0.371
+0.167
81.87%
1 ene 1982 año
0.27
-0.101
-27.26%
1 ene 1985 año
0.396
+0.126
46.85%
1 ene 1989 año
0.407
+0.01
2.55%
1 ene 1992 año
1.26
+0.853
209.89%
1 ene 1993 año
0.48
-0.78
-61.9%
1 ene 1994 año
0.407
-0.073
-15.27%
1 ene 1999 año
0.513
+0.106
26.14%
1 ene 2001 año
0.546
+0.033
6.43%
1 ene 2002 año
0.558
+0.012
2.2%
1 ene 2003 año
0.578
+0.02
3.58%
1 ene 2004 año
0.587
+0.009
1.56%
1 ene 2005 año
0.597
+0.01
1.7%
1 ene 2006 año
0.599
+0.002
0.34%
1 ene 2007 año
0.609
+0.01
1.67%
1 ene 2008 año
0.623
+0.014
2.3%
1 ene 2009 año
0.64
+0.017
2.73%
1 ene 2010 año
0.649
+0.009
1.41%
1 ene 2011 año
0.69
+0.041
6.32%
1 ene 2012 año
0.743
+0.053
7.68%
1 ene 2013 año
0.702
-0.041
-5.52%

Ranking de los países por los datos estadísticos actuales