33
/es/
AIzaSyAYiBZKx7MnpbEhh9jyipgxe19OcubqV5w
August 1, 2025
247499
Spain
ESP
true
2
1
Fertilizer consumption (% of fertilizer production)
2015,2014,2013,2012,2011,2010,2009,2008,2007,2006,2005,2004,2003
Download
Estadísticas Globales de la Biblioteca →Spain →

Fertilizer consumption (% of fertilizer production)

Estas estadísticas en otros países:

AfghanistanAlgeriaArab WorldArgentinaArmeniaAustraliaBahrainBangladeshBelarusBelgiumBosnia and HerzegovinaBrazilBulgariaCanadaCaribbean small statesCentral Europe and the BalticsChileChinaColombiaCroatiaCubaCzech RepublicDenmarkEarly-demographic dividendEast Asia & PacificEast Asia & Pacific (excluding high income)East Asia & Pacific (IDA & IBRD countries)Egypt, Arab Rep.EstoniaEuro areaEurope & Central AsiaEurope & Central Asia (excluding high income)Europe & Central Asia (IDA & IBRD countries)European UnionFinlandFragile and conflict affected situationsFranceGeorgiaGermanyGreeceHeavily indebted poor countries (HIPC)High incomeHungaryIBRD onlyIDA & IBRD totalIDA blendIDA onlyIDA totalIndiaIndonesiaIran, Islamic Rep.IraqIrelandIsraelItalyJapanJordanKazakhstanKorea, Rep.KuwaitLate-demographic dividendLatin America & Caribbean Latin America & Caribbean (excluding high income)Latin America & the Caribbean (IDA & IBRD countries)Least developed countries: UN classificationLebanonLibyaLithuaniaLow & middle incomeLow incomeLower middle incomeMalawiMalaysiaMaliMauritiusMexicoMiddle East & North AfricaMiddle East & North Africa (excluding high income)Middle East & North Africa (IDA & IBRD countries)Middle incomeMoroccoMyanmarNetherlandsNew ZealandNigeriaNorth AmericaNorwayOECD membersOmanOther small statesPakistanPeruPhilippinesPolandPortugalPost-demographic dividendPre-demographic dividendQatarRomaniaRussian FederationSaudi ArabiaSenegalSerbiaSlovak RepublicSloveniaSmall statesSouth AfricaSouth AsiaSouth Asia (IDA & IBRD)SpainSri LankaSub-Saharan Africa Sub-Saharan Africa (excluding high income)Sub-Saharan Africa (IDA & IBRD countries)SwedenSyrian Arab RepublicTajikistanThailandTrinidad and TobagoTunisiaTurkeyUkraineUnited Arab EmiratesUnited KingdomUnited StatesUpper middle incomeUruguayUzbekistanVenezuela, RBVietnamWorldZimbabwe

línea de tiempo (timeline):

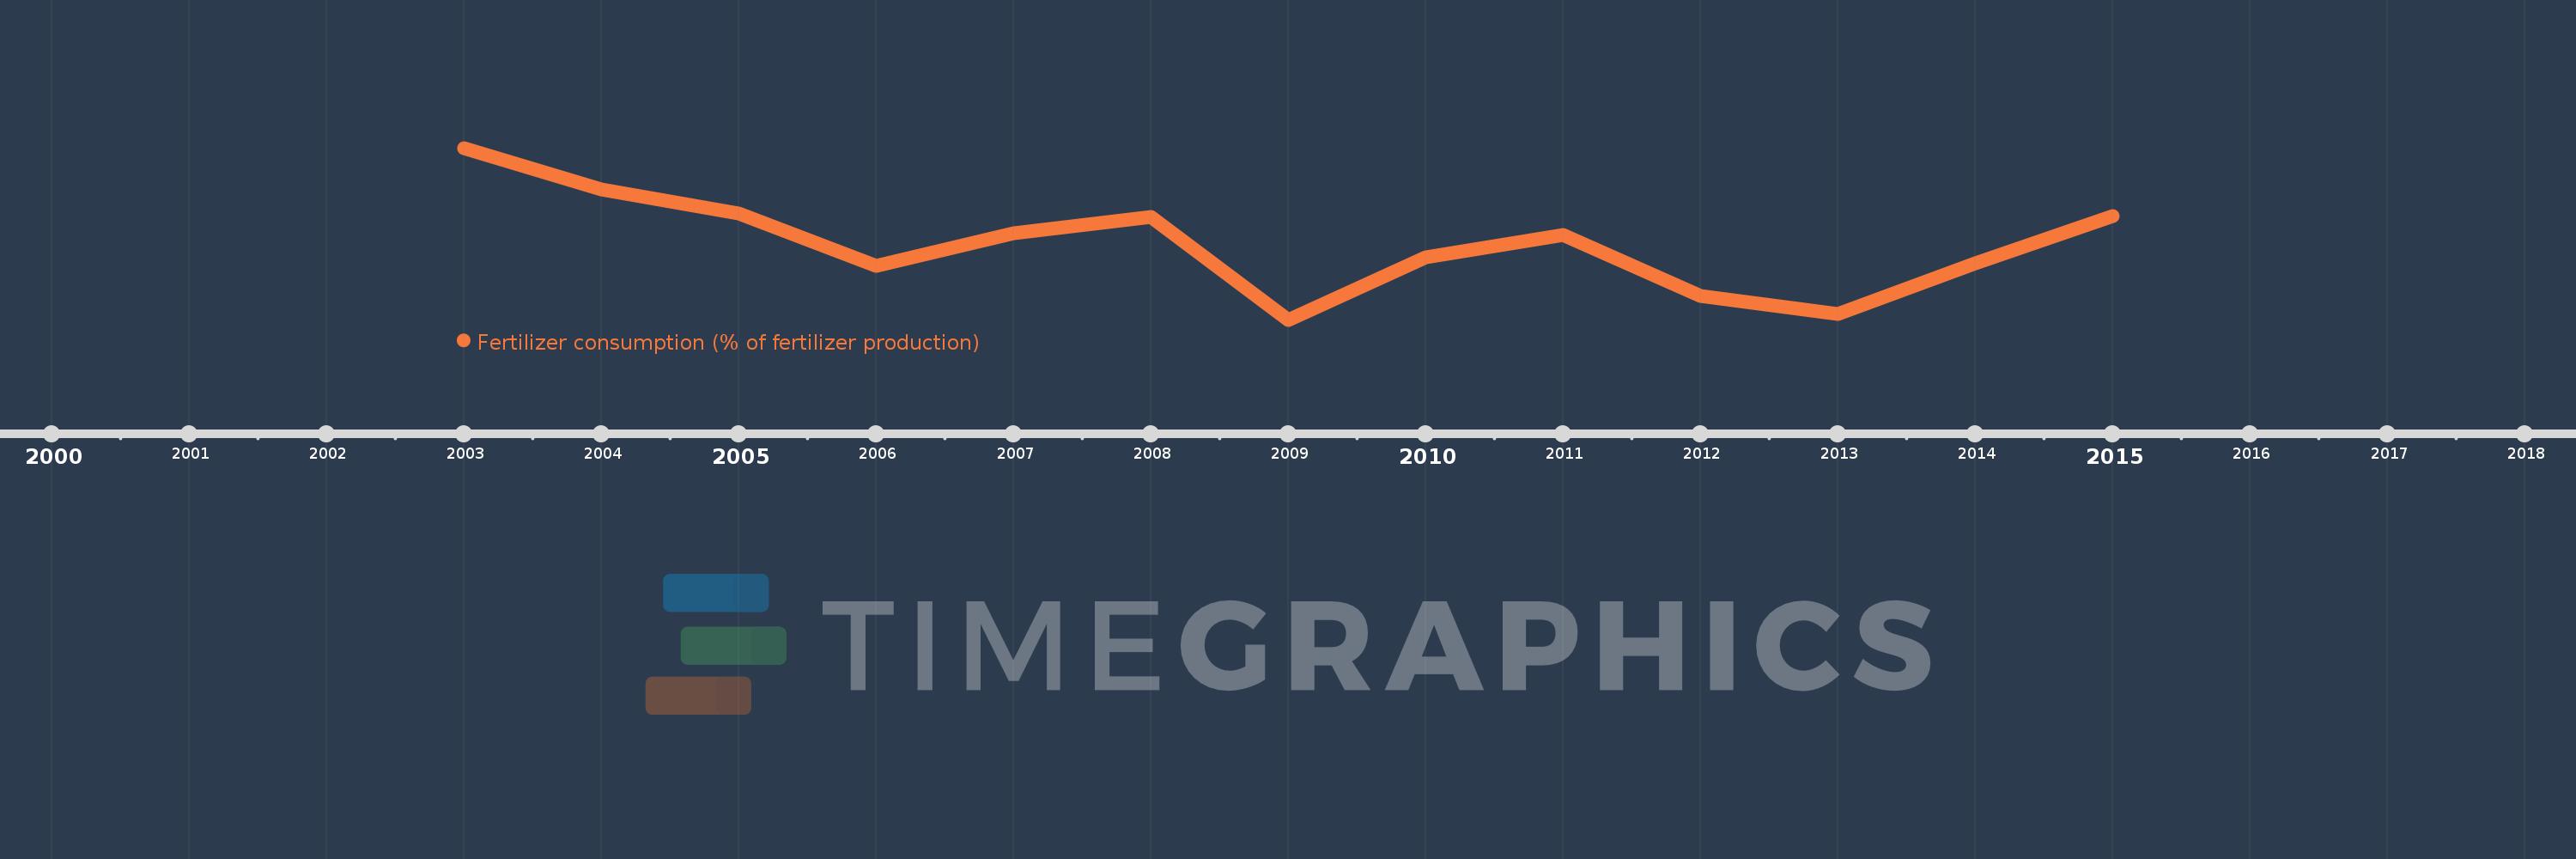
En esta escala de tiempo se presenta un gráfico de 2003 y 2015 de Spain. Los datos de 2002 están ausentes. El número de observaciones reales por fecha: 13.

Fuente (nombre):

Indicadores del desarrollo mundial

Fuente (organización):

Food and Agriculture Organization, electronic files and web site.

Categorías:

Agriculture & Rural Development

Se ha actualizado:

23 abr 2017 año

Los indicadores de los cambios de valor en los últimos años

En promedio:
109.859
Mínimo:
89.17
1 ene 2009 año
Máximo:
135.93
1 ene 2003 año
A la fecha de observación
Valor
Cambio absoluto
El cambio con respecto al valor anterior
1 ene 2003 año
135.93
+135.93
0.0%
1 ene 2004 año
124.596
-11.334
-8.34%
1 ene 2005 año
118.047
-6.549
-5.26%
1 ene 2006 año
103.737
-14.31
-12.12%
1 ene 2007 año
112.707
+8.969
8.65%
1 ene 2008 año
117.185
+4.479
3.97%
1 ene 2009 año
89.17
-28.015
-23.91%
1 ene 2010 año
106.145
+16.975
19.04%
1 ene 2011 año
112.151
+6.006
5.66%
1 ene 2012 año
95.724
-16.427
-14.65%
1 ene 2013 año
90.753
-4.971
-5.19%
1 ene 2014 año
104.528
+13.775
15.18%
1 ene 2015 año
117.495
+12.967
12.4%

Ranking de los países por los datos estadísticos actuales