29
/es/
es
AIzaSyAYiBZKx7MnpbEhh9jyipgxe19OcubqV5w
April 1, 2024
141761
Greece
GRC
true
2
1
Fertilizer consumption (% of fertilizer production)
2015,2014,2013,2012,2011,2010,2009,2008,2007,2006,2005,2004,2003
Download
Estadísticas Globales de la Biblioteca →Greece →

Fertilizer consumption (% of fertilizer production)

Estas estadísticas en otros países:
AfghanistanAlgeriaArab WorldArgentinaArmeniaAustraliaBahrainBangladeshBelarusBelgiumBosnia and HerzegovinaBrazilBulgariaCanadaCaribbean small statesCentral Europe and the BalticsChileChinaColombiaCroatiaCubaCzech RepublicDenmarkEarly-demographic dividendEast Asia & PacificEast Asia & Pacific (excluding high income)East Asia & Pacific (IDA & IBRD countries)Egypt, Arab Rep.EstoniaEuro areaEurope & Central AsiaEurope & Central Asia (excluding high income)Europe & Central Asia (IDA & IBRD countries)European UnionFinlandFragile and conflict affected situationsFranceGeorgiaGermanyGreeceHeavily indebted poor countries (HIPC)High incomeHungaryIBRD onlyIDA & IBRD totalIDA blendIDA onlyIDA totalIndiaIndonesiaIran, Islamic Rep.IraqIrelandIsraelItalyJapanJordanKazakhstanKorea, Rep.KuwaitLate-demographic dividendLatin America & Caribbean Latin America & Caribbean (excluding high income)Latin America & the Caribbean (IDA & IBRD countries)Least developed countries: UN classificationLebanonLibyaLithuaniaLow & middle incomeLow incomeLower middle incomeMalawiMalaysiaMaliMauritiusMexicoMiddle East & North AfricaMiddle East & North Africa (excluding high income)Middle East & North Africa (IDA & IBRD countries)Middle incomeMoroccoMyanmarNetherlandsNew ZealandNigeriaNorth AmericaNorwayOECD membersOmanOther small statesPakistanPeruPhilippinesPolandPortugalPost-demographic dividendPre-demographic dividendQatarRomaniaRussian FederationSaudi ArabiaSenegalSerbiaSlovak RepublicSloveniaSmall statesSouth AfricaSouth AsiaSouth Asia (IDA & IBRD)SpainSri LankaSub-Saharan Africa Sub-Saharan Africa (excluding high income)Sub-Saharan Africa (IDA & IBRD countries)SwedenSyrian Arab RepublicTajikistanThailandTrinidad and TobagoTunisiaTurkeyUkraineUnited Arab EmiratesUnited KingdomUnited StatesUpper middle incomeUruguayUzbekistanVenezuela, RBVietnamWorldZimbabwe
línea de tiempo (timeline):
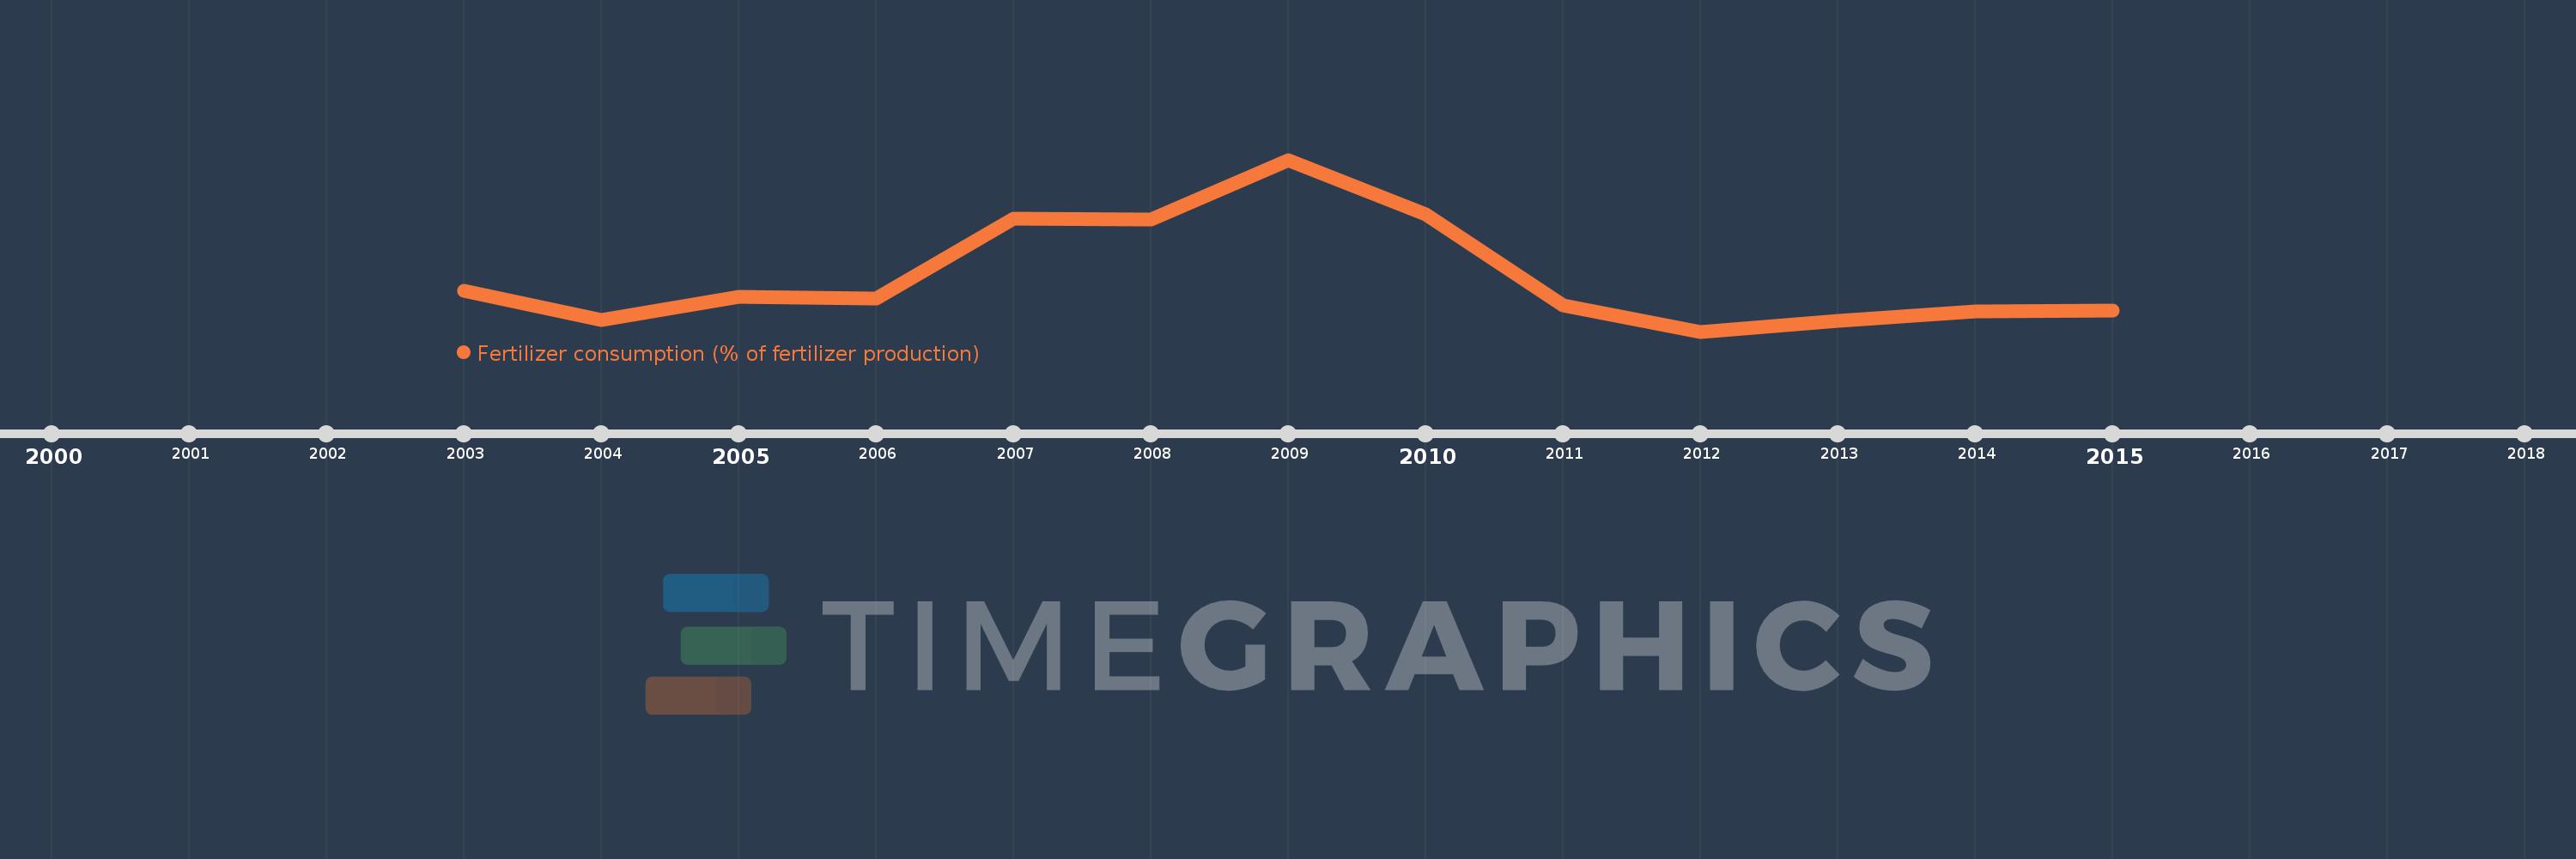
En esta escala de tiempo se presenta un gráfico de 2003 y 2015 de Greece. Los datos de 2002 están ausentes. El número de observaciones reales por fecha: 13.
Fuente (nombre):
Indicadores del desarrollo mundial
Fuente (organización):
Food and Agriculture Organization, electronic files and web site.
Categorías:
Agriculture & Rural Development
Se ha actualizado:
23 abr 2017 año
Los indicadores de los cambios de valor en los últimos años
En promedio:
238.248
Mínimo:
126.985
1 ene 2012 año
Máximo:
475.893
1 ene 2009 año
A la fecha de observación
Valor
Cambio absoluto
El cambio con respecto al valor anterior
1 ene 2003 año
210.573
+210.573
0.0%
1 ene 2004 año
149.854
-60.719
-28.84%
1 ene 2005 año
197.175
+47.322
31.58%
1 ene 2006 año
194.013
-3.163
-1.6%
1 ene 2007 año
356.47
+162.457
83.74%
1 ene 2008 año
354.175
-2.295
-0.64%
1 ene 2009 año
475.893
+121.718
34.37%
1 ene 2010 año
365.89
-110.003
-23.12%
1 ene 2011 año
179.773
-186.116
-50.87%
1 ene 2012 año
126.985
-52.789
-29.36%
1 ene 2013 año
148.732
+21.747
17.13%
1 ene 2014 año
168.503
+19.771
13.29%
1 ene 2015 año
169.187
+0.684
0.41%
Ranking de los países por los datos estadísticos actuales

Comentarios:

Enviar
PremiumAbout & FeedbackAcuerdoPrivacidad
logo
© 2022 Selected Technologies LLC – Morgan Hill, California