29
/es/
es
AIzaSyAYiBZKx7MnpbEhh9jyipgxe19OcubqV5w
April 1, 2024
237024
Serbia
SRB
true
2
1
Exports of goods and services (current LCU)
2016,2015,2014,2013,2012,2011,2010,2009,2008,2007,2006,2005,2004,2003,2002,2001,2000,1999,1998,1997,1996
Download
Estadísticas Globales de la Biblioteca →Serbia →

Exports of goods and services (current LCU)

Estas estadísticas en otros países:
AfghanistanAlbaniaAlgeriaAngolaAntigua and BarbudaArgentinaArmeniaArubaAustraliaAustriaAzerbaijanBahamas, TheBahrainBangladeshBarbadosBelarusBelgiumBelizeBeninBermudaBhutanBoliviaBosnia and HerzegovinaBotswanaBrazilBrunei DarussalamBulgariaBurkina FasoBurundiCabo VerdeCambodiaCameroonCanadaCentral African RepublicChadChileChinaColombiaComorosCongo, Dem. Rep.Congo, Rep.Costa RicaCote d'IvoireCroatiaCubaCyprusCzech RepublicDenmarkDjiboutiDominicaDominican RepublicEcuadorEgypt, Arab Rep.El SalvadorEquatorial GuineaEritreaEstoniaEthiopiaFaroe IslandsFijiFinlandFranceFrench PolynesiaGabonGambia, TheGeorgiaGermanyGhanaGreeceGrenadaGuatemalaGuineaGuinea-BissauGuyanaHaitiHondurasHong Kong SAR, ChinaHungaryIcelandIndiaIndonesiaIran, Islamic Rep.IraqIrelandIsraelItalyJamaicaJapanJordanKazakhstanKenyaKiribatiKorea, Rep.KosovoKuwaitKyrgyz RepublicLao PDRLatviaLebanonLesothoLiberiaLibyaLithuaniaLuxembourgMacao SAR, ChinaMacedonia, FYRMadagascarMalawiMalaysiaMaldivesMaliMaltaMauritaniaMauritiusMexicoMicronesia, Fed. Sts.MoldovaMongoliaMontenegroMoroccoMozambiqueMyanmarNamibiaNepalNetherlandsNew CaledoniaNew ZealandNicaraguaNigerNigeriaNorwayOmanPakistanPalauPanamaPapua New GuineaParaguayPeruPhilippinesPolandPortugalPuerto RicoQatarRomaniaRussian FederationRwandaSamoaSaudi ArabiaSenegalSerbiaSeychellesSierra LeoneSingaporeSlovak RepublicSloveniaSolomon IslandsSomaliaSouth AfricaSouth SudanSpainSri LankaSt. Kitts and NevisSt. LuciaSt. Vincent and the GrenadinesSudanSurinameSwazilandSwedenSwitzerlandSyrian Arab RepublicTajikistanTanzaniaThailandTimor-LesteTogoTongaTrinidad and TobagoTunisiaTurkeyTurkmenistanUgandaUkraineUnited Arab EmiratesUnited KingdomUnited StatesUruguayUzbekistanVanuatuVenezuela, RBVietnamWest Bank and GazaYemen, Rep.ZambiaZimbabwe
línea de tiempo (timeline):
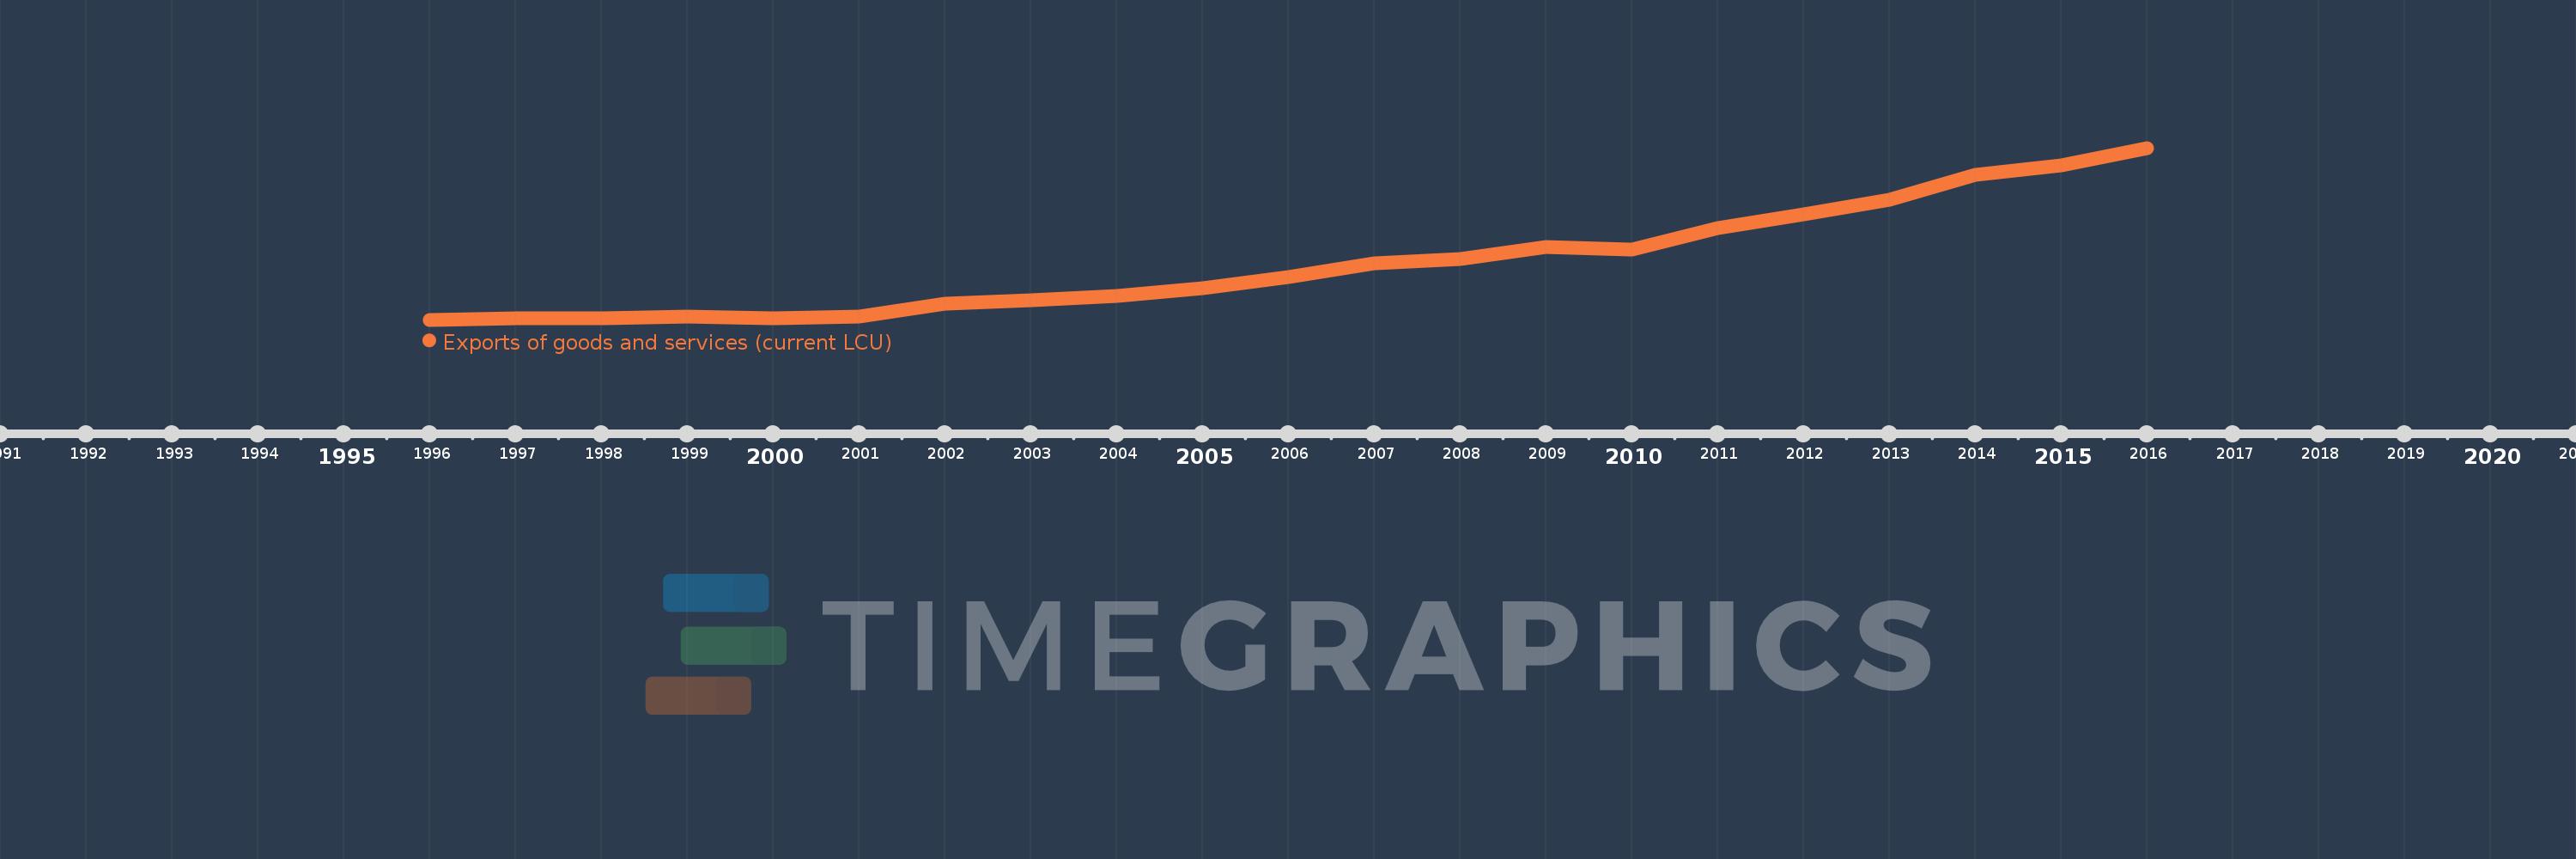
En esta escala de tiempo se presenta un gráfico de 1996 y 2016 de Serbia. Los datos de 1995 están ausentes. El número de observaciones reales por fecha: 21.
Fuente (nombre):
Indicadores del desarrollo mundial
Fuente (organización):
World Bank national accounts data, and OECD National Accounts data files.
Categorías:
Economy & Growth
Se ha actualizado:
23 abr 2017 año
Los indicadores de los cambios de valor en los últimos años
En promedio:
627.413 bn
Mínimo:
4.807 bn
1 ene 1996 año
Máximo:
1.887 billones
1 ene 2016 año
A la fecha de observación
Valor
Cambio absoluto
El cambio con respecto al valor anterior
1 ene 1996 año
4.807 bn
+4.807 bn
0.0%
1 ene 1997 año
16.889 bn
+12.082 bn
251.33%
1 ene 1998 año
22.361 bn
+5.472 bn
32.4%
1 ene 1999 año
38.805 bn
+16.444 bn
73.54%
1 ene 2000 año
25.187 bn
-13.618 bn
-35.09%
1 ene 2001 año
40.706 bn
+15.519 bn
61.61%
1 ene 2002 año
184.225 bn
+143.519 bn
352.58%
1 ene 2003 año
214.276 bn
+30.051 bn
16.31%
1 ene 2004 año
267.977 bn
+53.701 bn
25.06%
1 ene 2005 año
351.532 bn
+83.555 bn
31.18%
1 ene 2006 año
475.337 bn
+123.805 bn
35.22%
1 ene 2007 año
622.031 bn
+146.694 bn
30.86%
1 ene 2008 año
667.986 bn
+45.955 bn
7.39%
1 ene 2009 año
799.235 bn
+131.249 bn
19.65%
1 ene 2010 año
773.198 bn
-26.037 bn
-3.26%
1 ene 2011 año
1.01 billones
+236.913 bn
30.64%
1 ene 2012 año
1.158 billones
+147.647 bn
14.62%
1 ene 2013 año
1.324 billones
+165.84 bn
14.32%
1 ene 2014 año
1.597 billones
+273.494 bn
20.66%
1 ene 2015 año
1.695 billones
+98.242 bn
6.15%
1 ene 2016 año
1.887 billones
+191.901 bn
11.32%
Ranking de los países por los datos estadísticos actuales

Comentarios:

Enviar
PremiumAbout & FeedbackAcuerdoPrivacidad
logo
© 2022 Selected Technologies LLC – Morgan Hill, California