33
/es/
AIzaSyAYiBZKx7MnpbEhh9jyipgxe19OcubqV5w
August 1, 2025
149077
Haiti
HTI
true
2
1
Exports of goods and services (current LCU)
2016,2015,2014,2013,2012,2011,2010,2009,2008,2007,2006,2005,2004,2003,2002,2001,2000,1999,1998,1997,1996,1995,1994,1993,1992
Download
Estadísticas Globales de la Biblioteca →Haiti →

Exports of goods and services (current LCU)

Estas estadísticas en otros países:

AfghanistanAlbaniaAlgeriaAngolaAntigua and BarbudaArgentinaArmeniaArubaAustraliaAustriaAzerbaijanBahamas, TheBahrainBangladeshBarbadosBelarusBelgiumBelizeBeninBermudaBhutanBoliviaBosnia and HerzegovinaBotswanaBrazilBrunei DarussalamBulgariaBurkina FasoBurundiCabo VerdeCambodiaCameroonCanadaCentral African RepublicChadChileChinaColombiaComorosCongo, Dem. Rep.Congo, Rep.Costa RicaCote d'IvoireCroatiaCubaCyprusCzech RepublicDenmarkDjiboutiDominicaDominican RepublicEcuadorEgypt, Arab Rep.El SalvadorEquatorial GuineaEritreaEstoniaEthiopiaFaroe IslandsFijiFinlandFranceFrench PolynesiaGabonGambia, TheGeorgiaGermanyGhanaGreeceGrenadaGuatemalaGuineaGuinea-BissauGuyanaHaitiHondurasHong Kong SAR, ChinaHungaryIcelandIndiaIndonesiaIran, Islamic Rep.IraqIrelandIsraelItalyJamaicaJapanJordanKazakhstanKenyaKiribatiKorea, Rep.KosovoKuwaitKyrgyz RepublicLao PDRLatviaLebanonLesothoLiberiaLibyaLithuaniaLuxembourgMacao SAR, ChinaMacedonia, FYRMadagascarMalawiMalaysiaMaldivesMaliMaltaMauritaniaMauritiusMexicoMicronesia, Fed. Sts.MoldovaMongoliaMontenegroMoroccoMozambiqueMyanmarNamibiaNepalNetherlandsNew CaledoniaNew ZealandNicaraguaNigerNigeriaNorwayOmanPakistanPalauPanamaPapua New GuineaParaguayPeruPhilippinesPolandPortugalPuerto RicoQatarRomaniaRussian FederationRwandaSamoaSaudi ArabiaSenegalSerbiaSeychellesSierra LeoneSingaporeSlovak RepublicSloveniaSolomon IslandsSomaliaSouth AfricaSouth SudanSpainSri LankaSt. Kitts and NevisSt. LuciaSt. Vincent and the GrenadinesSudanSurinameSwazilandSwedenSwitzerlandSyrian Arab RepublicTajikistanTanzaniaThailandTimor-LesteTogoTongaTrinidad and TobagoTunisiaTurkeyTurkmenistanUgandaUkraineUnited Arab EmiratesUnited KingdomUnited StatesUruguayUzbekistanVanuatuVenezuela, RBVietnamWest Bank and GazaYemen, Rep.ZambiaZimbabwe

línea de tiempo (timeline):

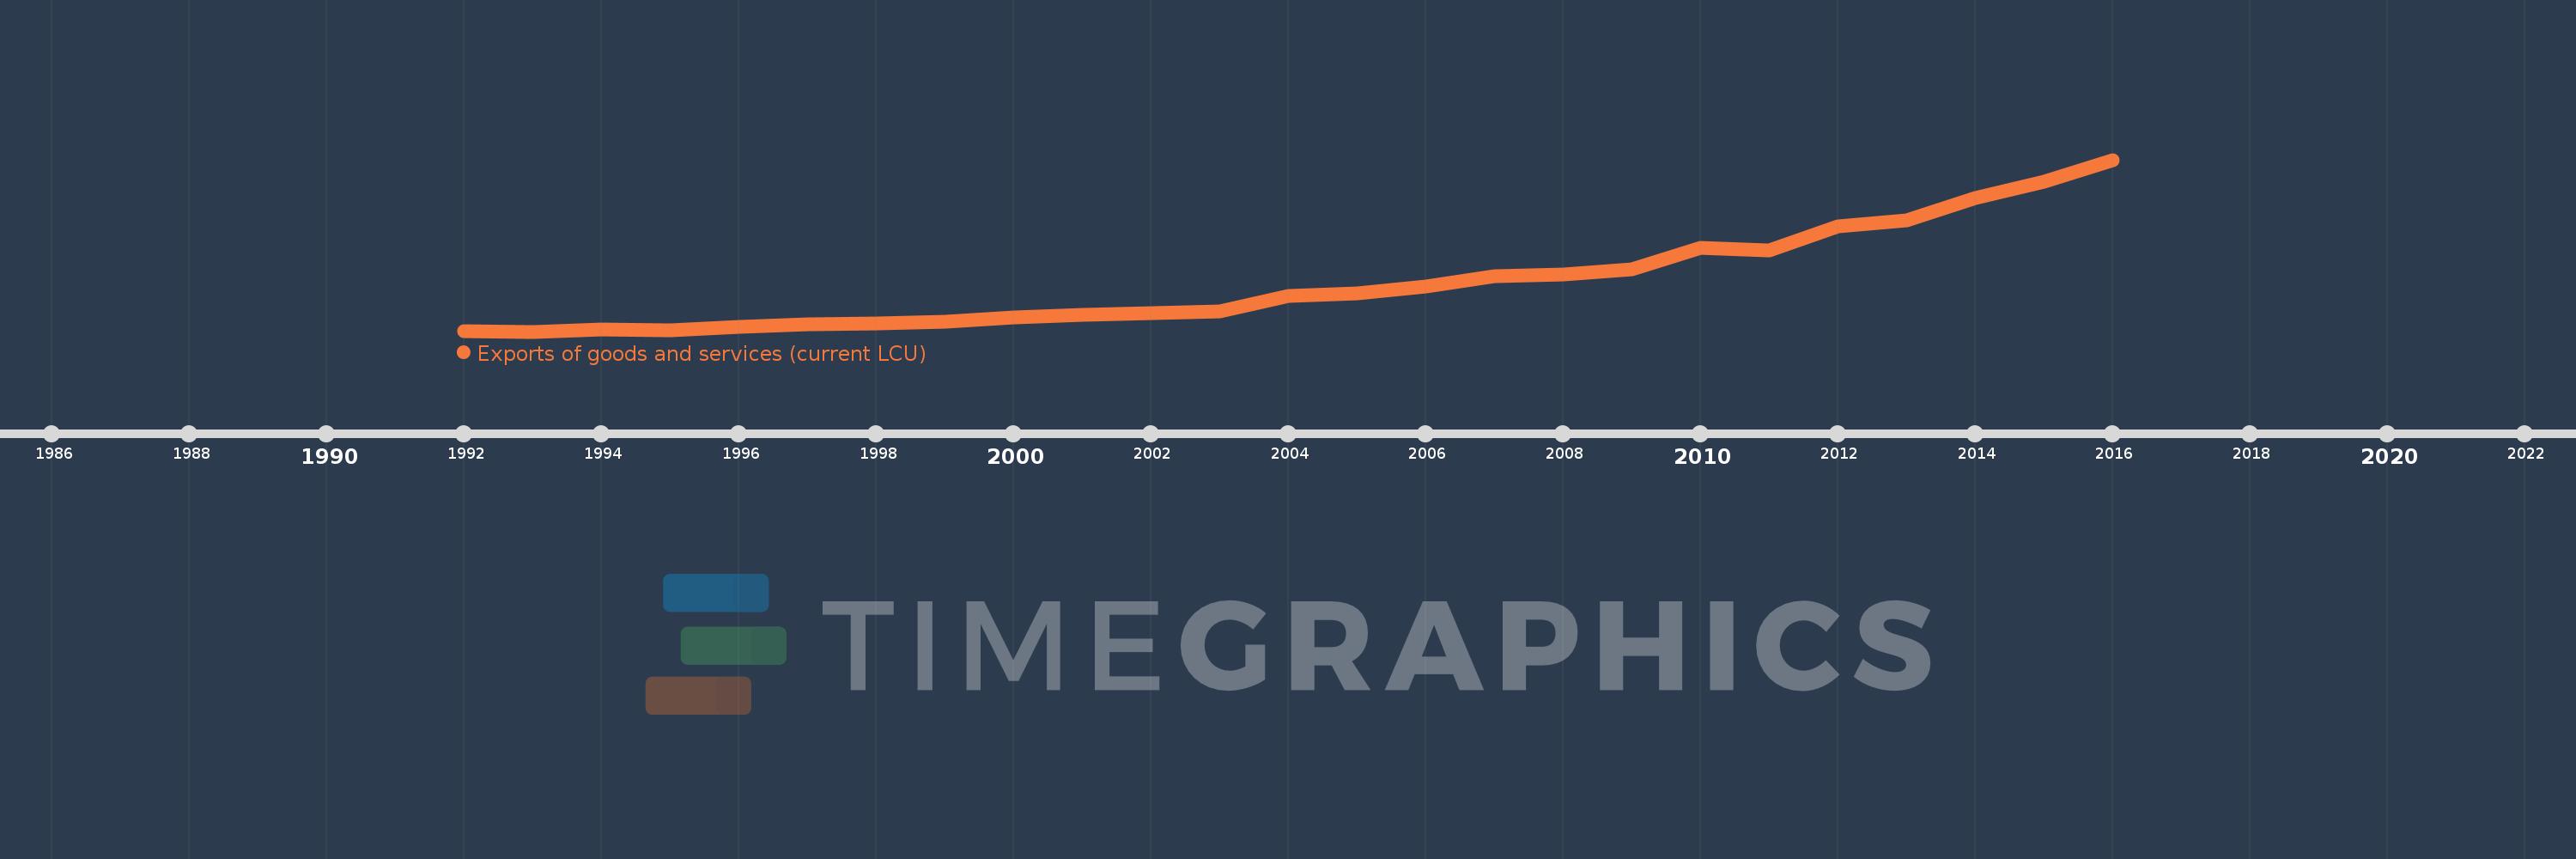
En esta escala de tiempo se presenta un gráfico de 1992 y 2016 de Haiti. Los datos de 1991 están ausentes. El número de observaciones reales por fecha: 25.

Fuente (nombre):

Indicadores del desarrollo mundial

Fuente (organización):

World Bank national accounts data, and OECD National Accounts data files.

Categorías:

Economy & Growth

Se ha actualizado:

23 abr 2017 año

Los indicadores de los cambios de valor en los últimos años

En promedio:
25.572 bn
Mínimo:
1.567 bn
1 ene 1993 año
Máximo:
85.1 bn
1 ene 2016 año
A la fecha de observación
Valor
Cambio absoluto
El cambio con respecto al valor anterior
1 ene 1992 año
1.864 bn
+1.864 bn
0.0%
1 ene 1993 año
1.567 bn
-297.0 millones
-15.93%
1 ene 1994 año
2.512 bn
+945.0 millones
60.31%
1 ene 1995 año
2.052 bn
-460.0 millones
-18.31%
1 ene 1996 año
3.72 bn
+1.668 bn
81.29%
1 ene 1997 año
5.284 bn
+1.564 bn
42.04%
1 ene 1998 año
5.646 bn
+362.0 millones
6.85%
1 ene 1999 año
6.237 bn
+591.0 millones
10.47%
1 ene 2000 año
8.483 bn
+2.246 bn
36.01%
1 ene 2001 año
9.849 bn
+1.366 bn
16.1%
1 ene 2002 año
10.594 bn
+745.0 millones
7.56%
1 ene 2003 año
11.403 bn
+809.0 millones
7.64%
1 ene 2004 año
19.032 bn
+7.629 bn
66.9%
1 ene 2005 año
20.228 bn
+1.196 bn
6.28%
1 ene 2006 año
23.592 bn
+3.364 bn
16.63%
1 ene 2007 año
28.563 bn
+4.971 bn
21.07%
1 ene 2008 año
29.543 bn
+980.0 millones
3.43%
1 ene 2009 año
31.878 bn
+2.335 bn
7.9%
1 ene 2010 año
42.084 bn
+10.206 bn
32.02%
1 ene 2011 año
40.956 bn
-1.128 bn
-2.68%
1 ene 2012 año
52.848 bn
+11.892 bn
29.04%
1 ene 2013 año
55.466 bn
+2.618 bn
4.95%
1 ene 2014 año
66.544 bn
+11.078 bn
19.97%
1 ene 2015 año
74.264 bn
+7.72 bn
11.6%
1 ene 2016 año
85.1 bn
+10.836 bn
14.59%

Ranking de los países por los datos estadísticos actuales