33
/es/
AIzaSyB4mHJ5NPEv-XzF7P6NDYXjlkCWaeKw5bc
November 30, 2025
233987
Sao Tome and Principe
STP
true
2
1
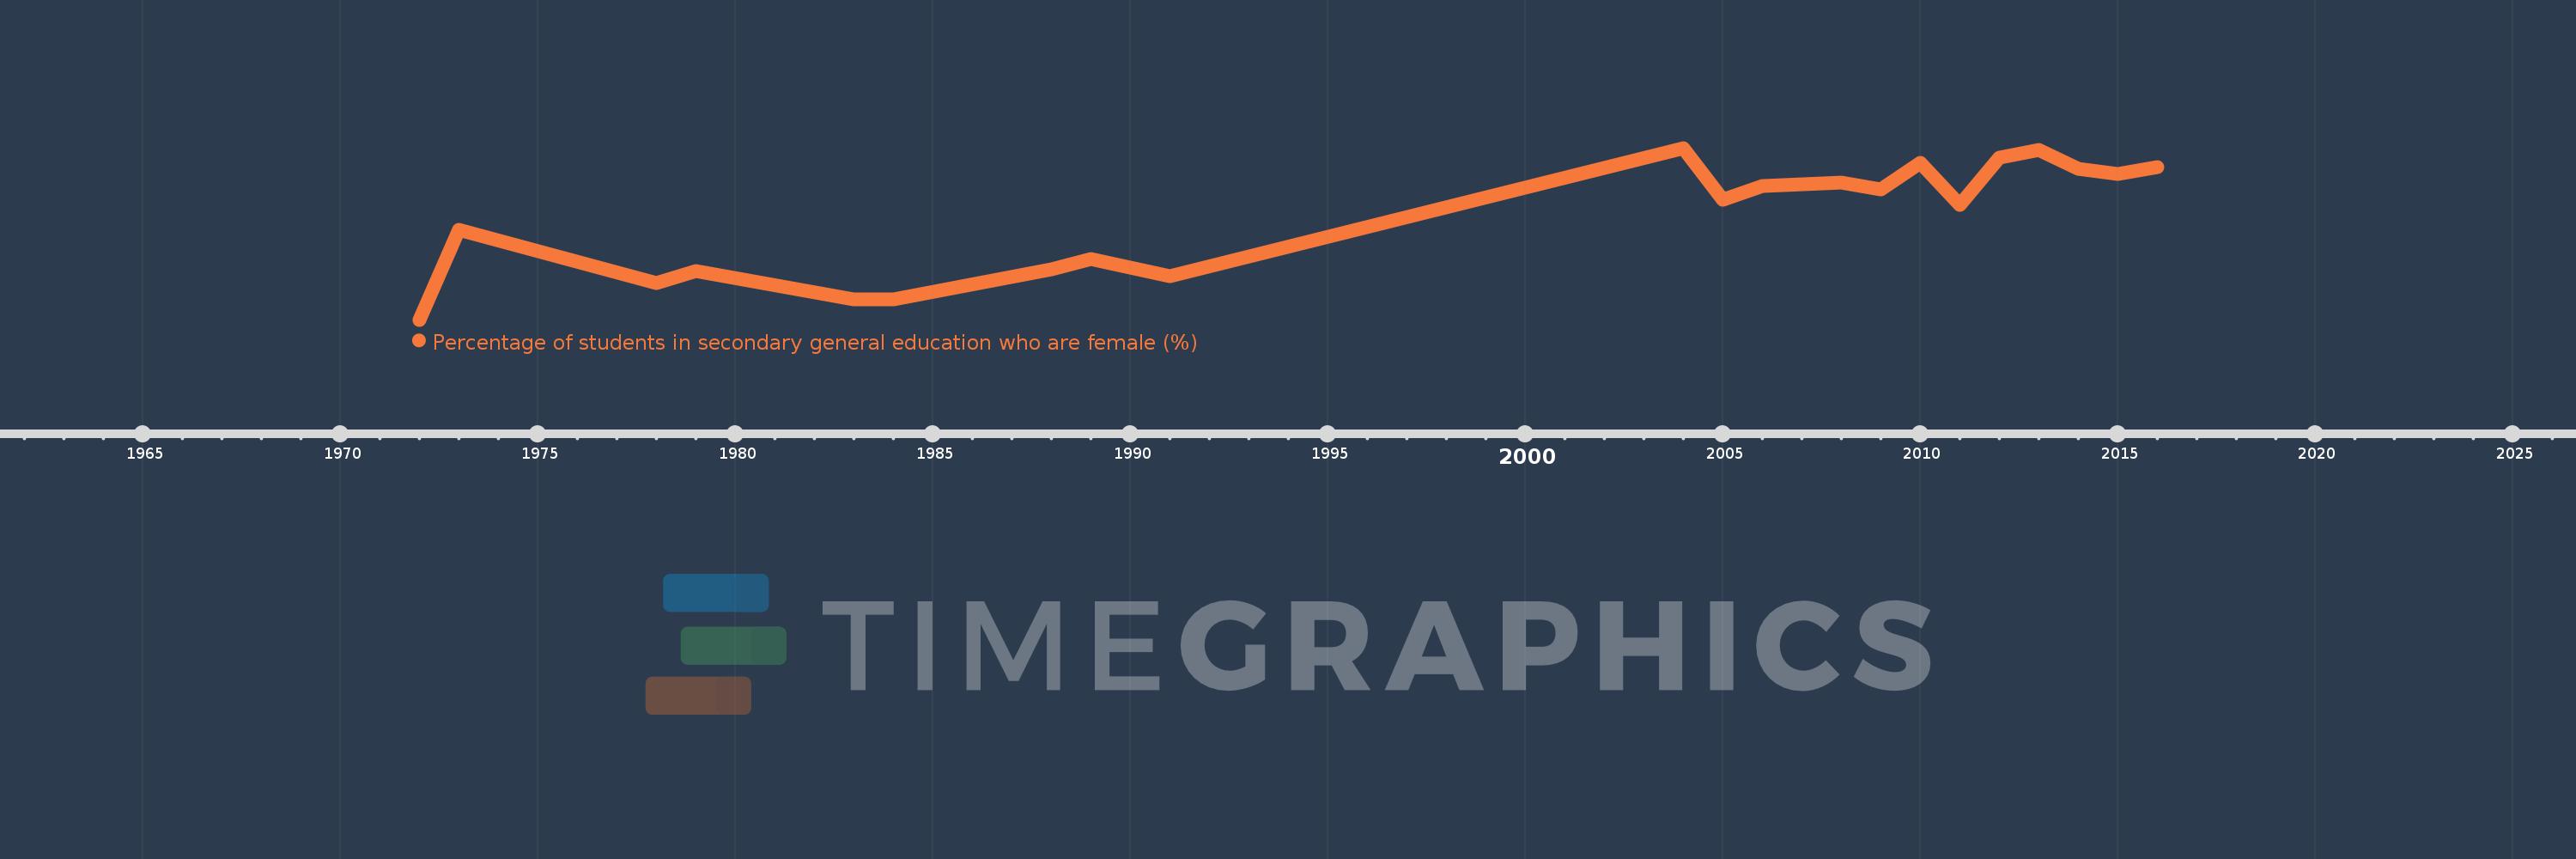
Percentage of students in secondary general education who are female (%)
2016,2015,2014,2013,2012,2011,2010,2009,2008,2006,2005,2004,1991,1989,1988,1984,1983,1979,1978,1973,1972