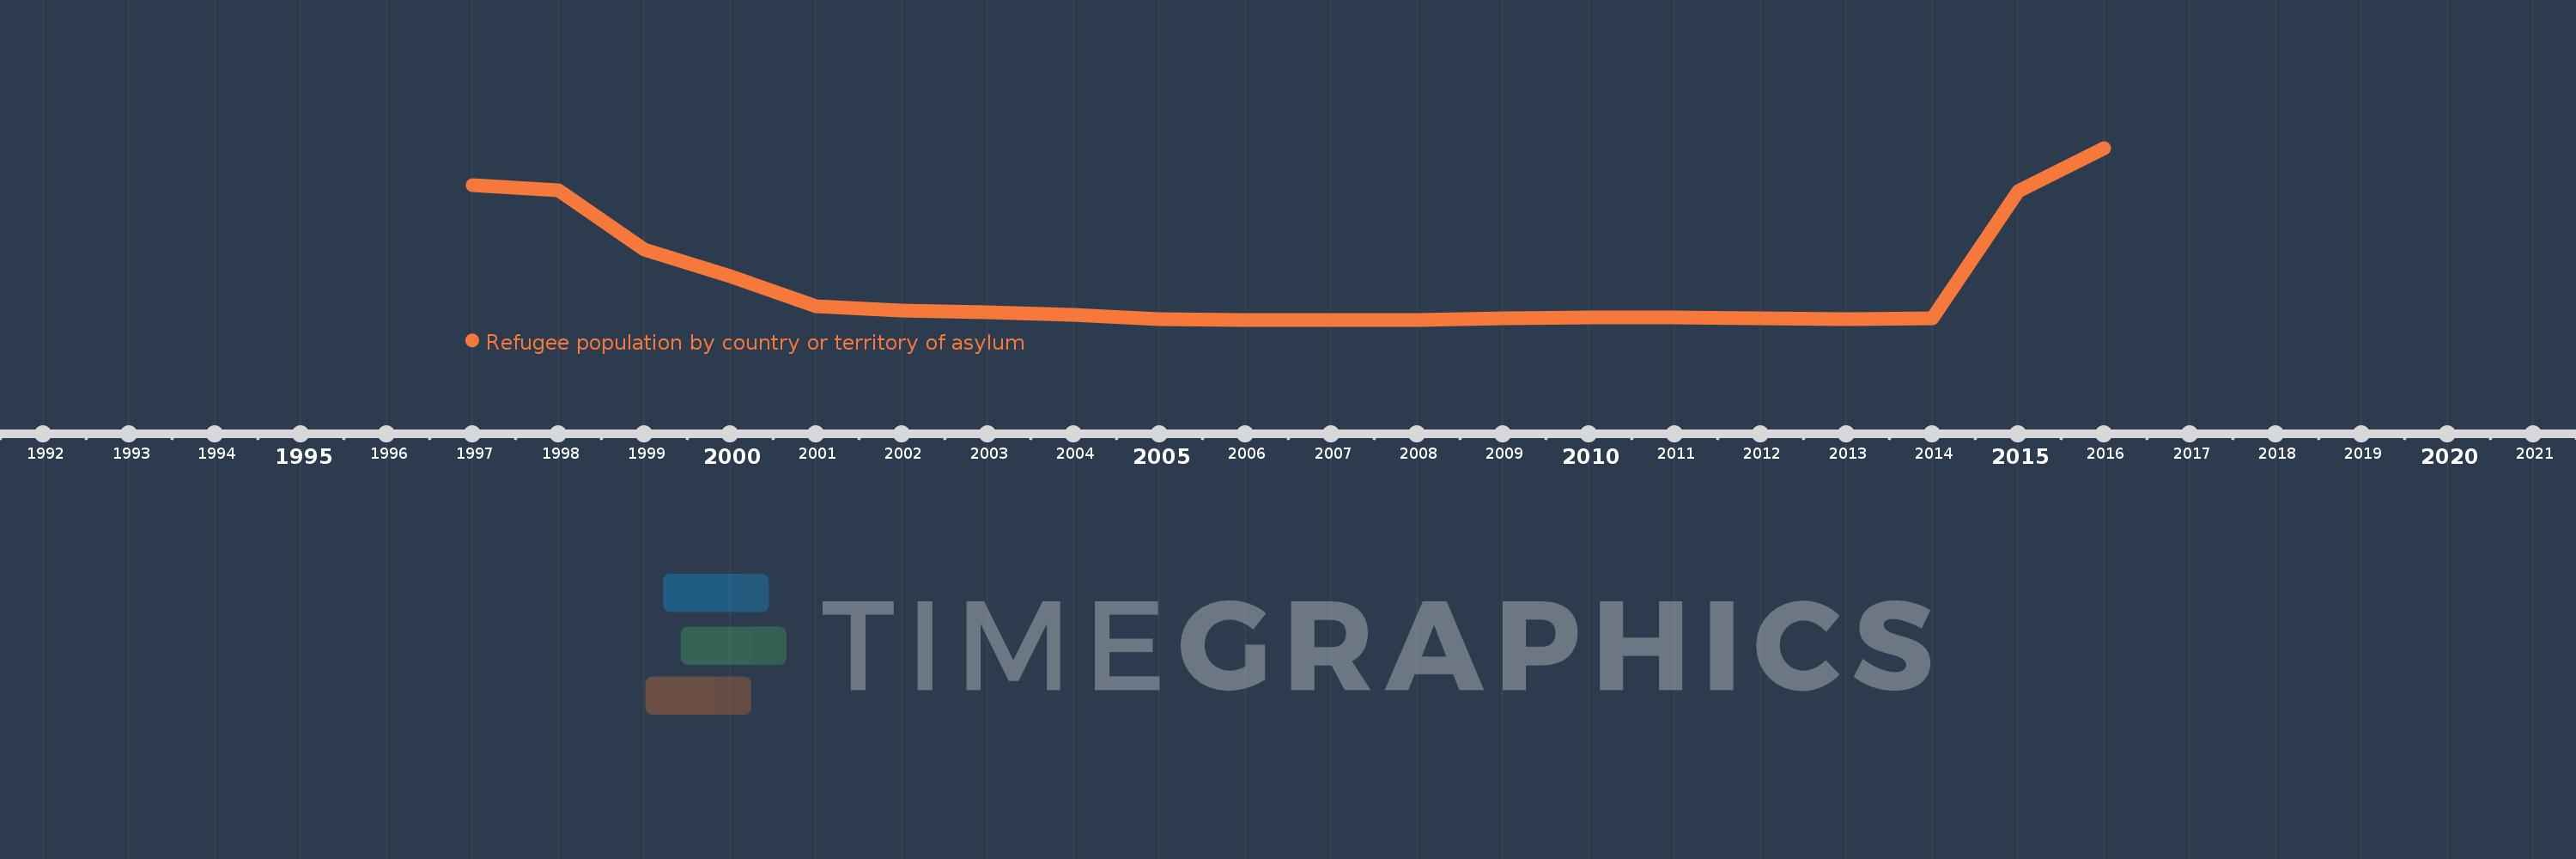
En esta escala de tiempo se presenta un gráfico de 1997 y 2016 de Russian Federation. Los datos de 1996 están ausentes. El número de observaciones reales por fecha: 20.
Fuente (nombre):
Indicadores del desarrollo mundial
Fuente (organización):
United Nations High Commissioner for Refugees (UNHCR), Statistical Yearbook and data files, complemented by statistics on Palestinian refugees under the mandate of the UNRWA as published on its website. Data from UNHCR are available online at: www.unhcr.org/statistics/populationdatabase.
Categorías:
Health, Social Development
Se ha actualizado:
23 abr 2017 año
Los indicadores de los cambios de valor en los últimos años
En promedio:
67.135 mil
Mínimo:
1.425 mil
1 ene 2007 año
Máximo:
314.506 mil
1 ene 2016 año
A la fecha de observación
Valor
Cambio absoluto
El cambio con respecto al valor anterior
1 ene 1997 año
246.691 mil
+246.691 mil
0.0%
1 ene 1998 año
237.72 mil
-8.971 mil
-3.64%
1 ene 1999 año
128.574 mil
-109.146 mil
-45.91%
1 ene 2000 año
80.06 mil
-48.514 mil
-37.73%
1 ene 2001 año
26.265 mil
-53.795 mil
-67.19%
1 ene 2002 año
17.97 mil
-8.295 mil
-31.58%
1 ene 2003 año
14.969 mil
-3.001 mil
-16.7%
1 ene 2004 año
9.899 mil
-5.07 mil
-33.87%
1 ene 2005 año
1.852 mil
-8.047 mil
-81.29%
1 ene 2006 año
1.523 mil
-329.0
-17.76%
1 ene 2007 año
1.425 mil
-98.0
-6.43%
1 ene 2008 año
1.655 mil
+230.0
16.14%
1 ene 2009 año
3.479 mil
+1.824 mil
110.21%
1 ene 2010 año
4.88 mil
+1.401 mil
40.27%
1 ene 2011 año
4.922 mil
+42.0
0.86%
1 ene 2012 año
3.914 mil
-1.008 mil
-20.48%
1 ene 2013 año
3.178 mil
-736.0
-18.8%
1 ene 2014 año
3.458 mil
+280.0
8.81%
1 ene 2015 año
235.75 mil
+232.292 mil
6.72 mil%
1 ene 2016 año
314.506 mil
+78.756 mil
33.41%
Ranking de los países por los datos estadísticos actuales