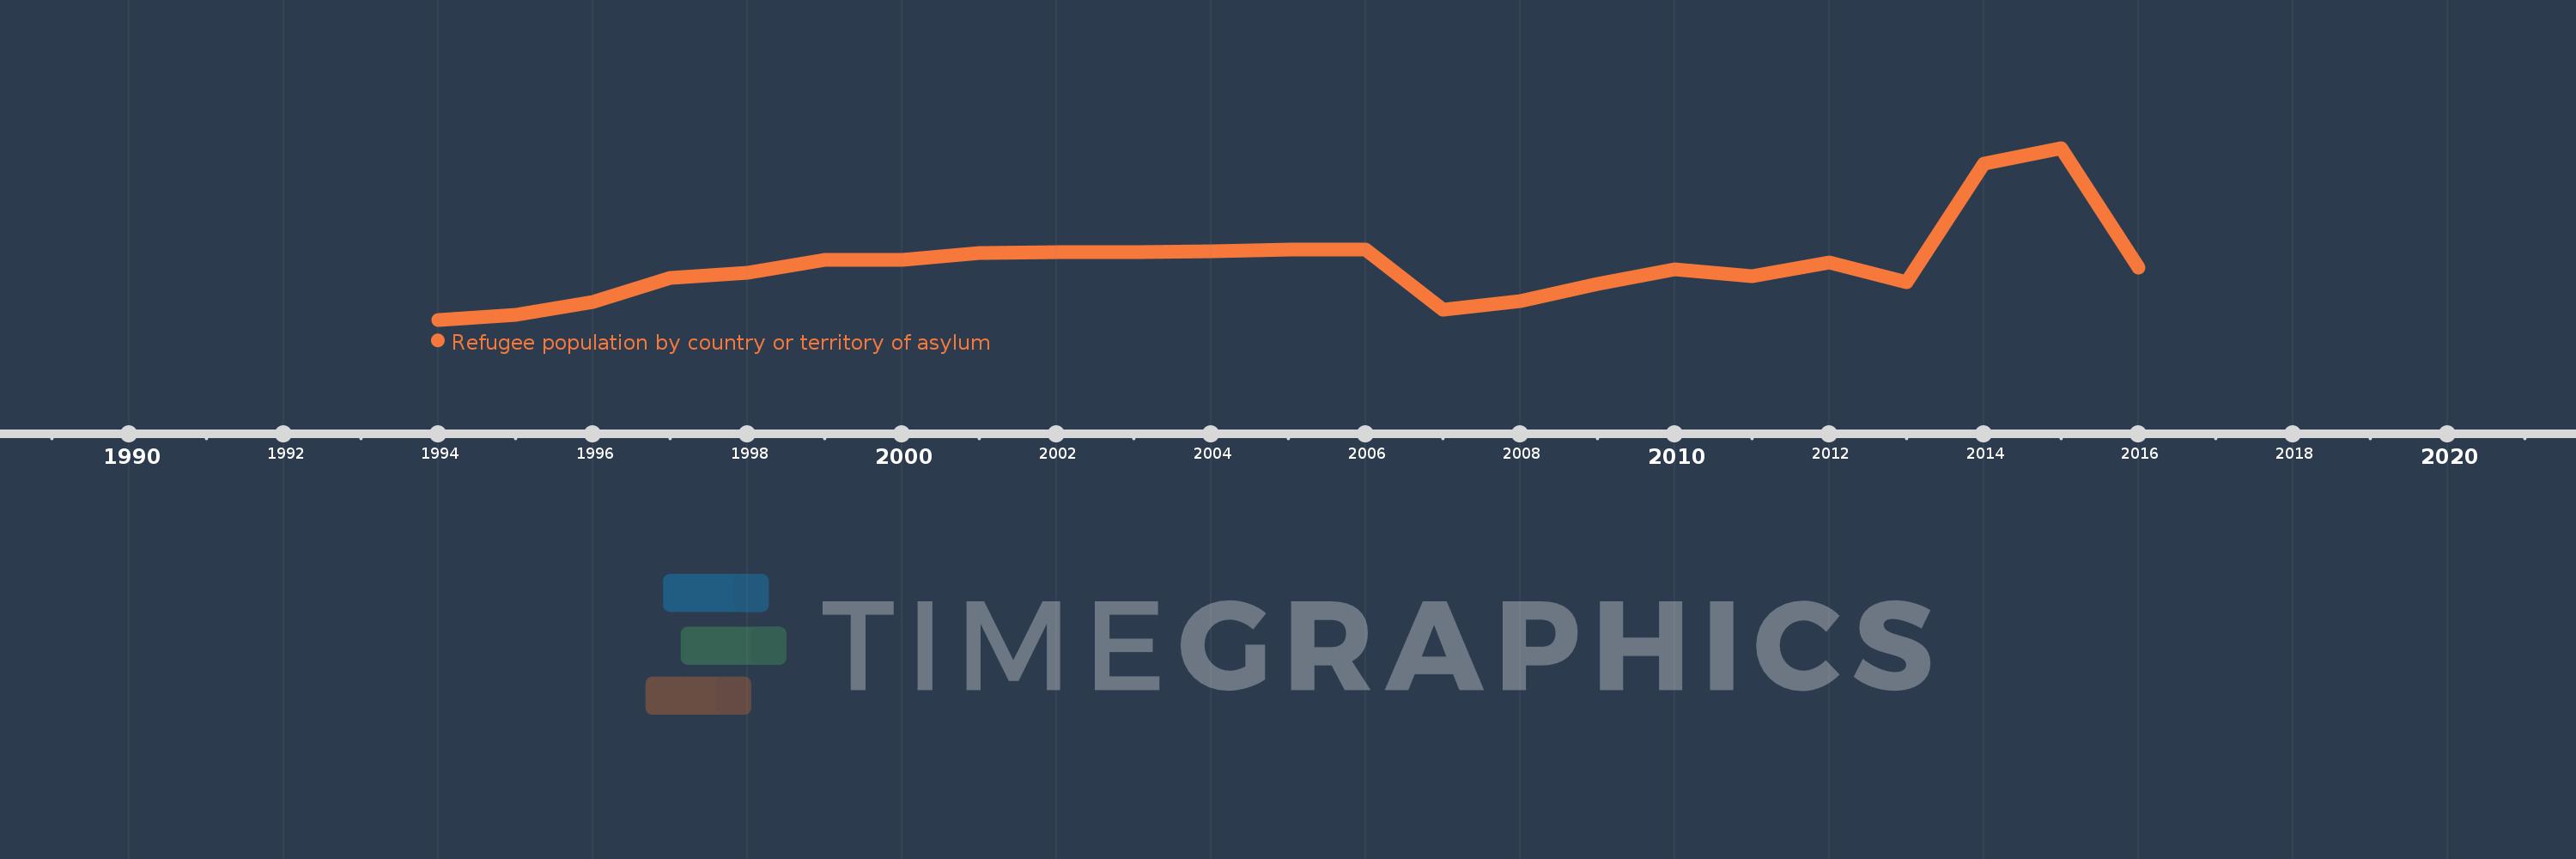
En esta escala de tiempo se presenta un gráfico de 1994 y 2016 de Libya. Los datos de 1993 están ausentes. El número de observaciones reales por fecha: 23.
Fuente (nombre):
Indicadores del desarrollo mundial
Fuente (organización):
United Nations High Commissioner for Refugees (UNHCR), Statistical Yearbook and data files, complemented by statistics on Palestinian refugees under the mandate of the UNRWA as published on its website. Data from UNHCR are available online at: www.unhcr.org/statistics/populationdatabase.
Categorías:
Health, Social Development
Se ha actualizado:
23 abr 2017 año
Los indicadores de los cambios de valor en los últimos años
En promedio:
9.831 mil
Mínimo:
1.185 mil
1 ene 1994 año
Máximo:
27.964 mil
1 ene 2015 año
A la fecha de observación
Valor
Cambio absoluto
El cambio con respecto al valor anterior
1 ene 1994 año
1.185 mil
+1.185 mil
0.0%
1 ene 1995 año
1.999 mil
+814.0
68.69%
1 ene 1996 año
3.973 mil
+1.974 mil
98.75%
1 ene 1997 año
7.747 mil
+3.774 mil
94.99%
1 ene 1998 año
8.481 mil
+734.0
9.47%
1 ene 1999 año
10.558 mil
+2.077 mil
24.49%
1 ene 2000 año
10.535 mil
-23.0
-0.22%
1 ene 2001 año
11.543 mil
+1.008 mil
9.57%
1 ene 2002 año
11.664 mil
+121.0
1.05%
1 ene 2003 año
11.666 mil
+2.0
0.02%
1 ene 2004 año
11.897 mil
+231.0
1.98%
1 ene 2005 año
12.166 mil
+269.0
2.26%
1 ene 2006 año
12.166 mil
0.0
0.0%
1 ene 2007 año
2.76 mil
-9.406 mil
-77.31%
1 ene 2008 año
4.098 mil
+1.338 mil
48.48%
1 ene 2009 año
6.713 mil
+2.615 mil
63.81%
1 ene 2010 año
9.005 mil
+2.292 mil
34.14%
1 ene 2011 año
7.923 mil
-1.082 mil
-12.02%
1 ene 2012 año
10.13 mil
+2.207 mil
27.86%
1 ene 2013 año
7.065 mil
-3.065 mil
-30.26%
1 ene 2014 año
25.561 mil
+18.496 mil
261.8%
1 ene 2015 año
27.964 mil
+2.403 mil
9.4%
1 ene 2016 año
9.305 mil
-18.659 mil
-66.73%
Ranking de los países por los datos estadísticos actuales