29
/es/
es
AIzaSyAYiBZKx7MnpbEhh9jyipgxe19OcubqV5w
April 1, 2024
227464
Qatar
QAT
true
2
1
Gross domestic savings (current LCU)
2016,2015,2014,2013,2012,2011,2010,2009,2008,2007,2006,2005,2004,2003,2002,2001,2000,1999,1998,1997,1996,1995
Download
Estadísticas Globales de la Biblioteca →Qatar →

Gross domestic savings (current LCU)

Estas estadísticas en otros países:
AfghanistanAlbaniaAlgeriaAngolaAntigua and BarbudaArgentinaArmeniaArubaAustraliaAustriaAzerbaijanBahamas, TheBahrainBangladeshBarbadosBelarusBelgiumBelizeBeninBermudaBhutanBoliviaBosnia and HerzegovinaBotswanaBrazilBrunei DarussalamBulgariaBurkina FasoBurundiCabo VerdeCambodiaCameroonCanadaCentral African RepublicChadChileChinaColombiaComorosCongo, Dem. Rep.Congo, Rep.Costa RicaCote d'IvoireCroatiaCubaCyprusCzech RepublicDenmarkDjiboutiDominicaDominican RepublicEcuadorEgypt, Arab Rep.El SalvadorEquatorial GuineaEritreaEstoniaEthiopiaFaroe IslandsFijiFinlandFranceGabonGambia, TheGeorgiaGermanyGhanaGreeceGrenadaGuatemalaGuineaGuinea-BissauGuyanaHaitiHondurasHong Kong SAR, ChinaHungaryIcelandIndiaIndonesiaIran, Islamic Rep.IraqIrelandIsraelItalyJamaicaJapanJordanKazakhstanKenyaKiribatiKorea, Rep.KosovoKuwaitKyrgyz RepublicLao PDRLatviaLebanonLesothoLiberiaLibyaLithuaniaLuxembourgMacao SAR, ChinaMacedonia, FYRMadagascarMalawiMalaysiaMaldivesMaliMaltaMauritaniaMauritiusMexicoMicronesia, Fed. Sts.MoldovaMongoliaMontenegroMoroccoMozambiqueNamibiaNepalNetherlandsNew CaledoniaNew ZealandNicaraguaNigerNigeriaNorwayOmanPakistanPanamaPapua New GuineaParaguayPeruPhilippinesPolandPortugalPuerto RicoQatarRomaniaRussian FederationRwandaSaudi ArabiaSenegalSerbiaSeychellesSierra LeoneSingaporeSlovak RepublicSloveniaSolomon IslandsSomaliaSouth AfricaSouth SudanSpainSri LankaSt. Kitts and NevisSt. LuciaSt. Vincent and the GrenadinesSudanSurinameSwazilandSwedenSwitzerlandSyrian Arab RepublicTajikistanTanzaniaThailandTimor-LesteTogoTongaTrinidad and TobagoTunisiaTurkeyTurkmenistanUgandaUkraineUnited Arab EmiratesUnited KingdomUnited StatesUruguayUzbekistanVanuatuVenezuela, RBVietnamWest Bank and GazaYemen, Rep.ZambiaZimbabwe
línea de tiempo (timeline):
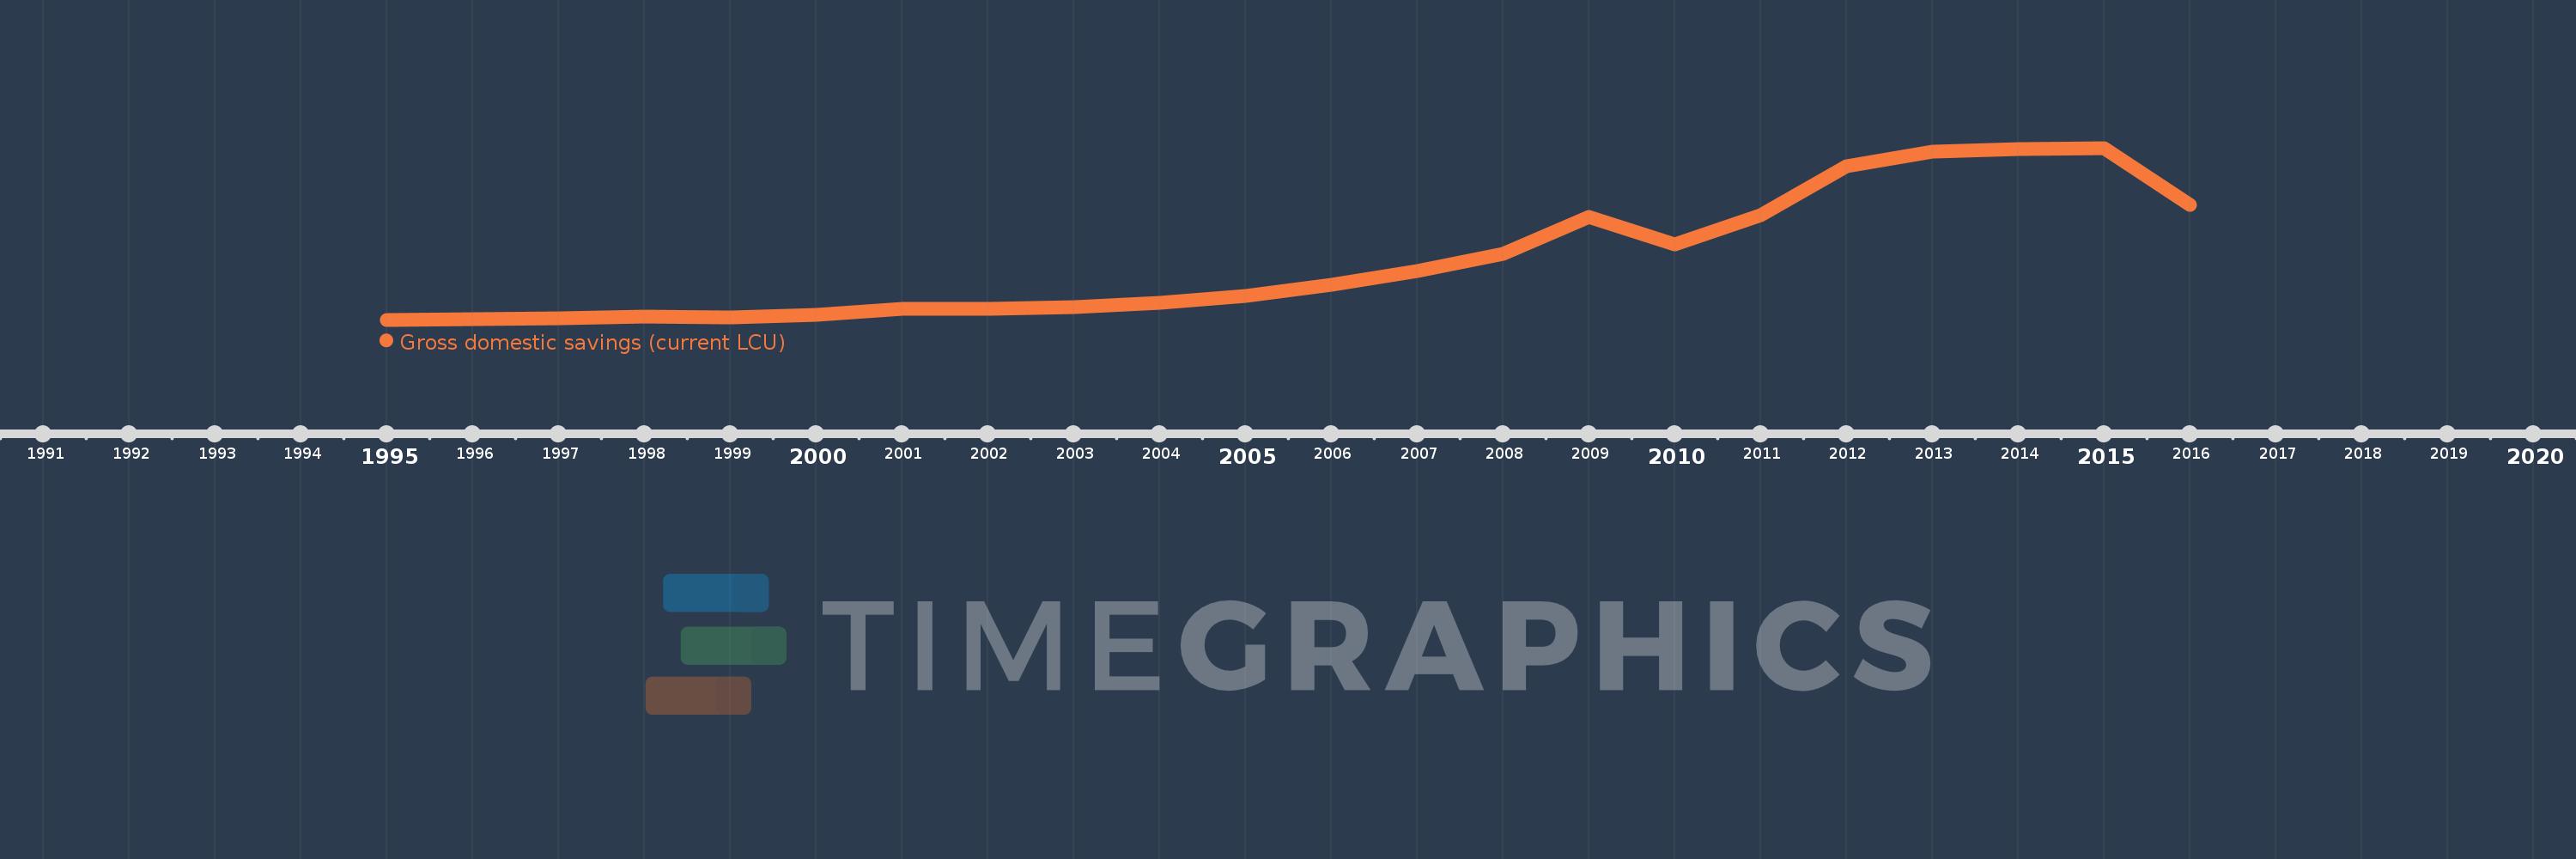
En esta escala de tiempo se presenta un gráfico de 1995 y 2016 de Qatar. Los datos de 1994 están ausentes. El número de observaciones reales por fecha: 22.
Fuente (nombre):
Indicadores del desarrollo mundial
Fuente (organización):
World Bank national accounts data, and OECD National Accounts data files.
Categorías:
Economy & Growth
Se ha actualizado:
23 abr 2017 año
Los indicadores de los cambios de valor en los últimos años
En promedio:
183.578 bn
Mínimo:
9.563 bn
1 ene 1995 año
Máximo:
516.092 bn
1 ene 2015 año
A la fecha de observación
Valor
Cambio absoluto
El cambio con respecto al valor anterior
1 ene 1995 año
9.563 bn
+9.563 bn
0.0%
1 ene 1996 año
10.692 bn
+1.129 bn
11.81%
1 ene 1997 año
13.094 bn
+2.402 bn
22.47%
1 ene 1998 año
19.553 bn
+6.459 bn
49.33%
1 ene 1999 año
16.092 bn
-3.461 bn
-17.7%
1 ene 2000 año
24.013 bn
+7.921 bn
49.22%
1 ene 2001 año
42.088 bn
+18.075 bn
75.27%
1 ene 2002 año
42.094 bn
+6.0 millones
0.01%
1 ene 2003 año
45.718 bn
+3.624 bn
8.61%
1 ene 2004 año
58.333 bn
+12.615 bn
27.59%
1 ene 2005 año
80.252 bn
+21.919 bn
37.58%
1 ene 2006 año
113.03 bn
+32.778 bn
40.84%
1 ene 2007 año
152.808 bn
+39.778 bn
35.19%
1 ene 2008 año
204.433 bn
+51.625 bn
33.78%
1 ene 2009 año
312.211 bn
+107.778 bn
52.72%
1 ene 2010 año
231.71 bn
-80.501 bn
-25.78%
1 ene 2011 año
318.11 bn
+86.4 bn
37.29%
1 ene 2012 año
461.383 bn
+143.273 bn
45.04%
1 ene 2013 año
505.587 bn
+44.204 bn
9.58%
1 ene 2014 año
512.726 bn
+7.139 bn
1.41%
1 ene 2015 año
516.092 bn
+3.366 bn
0.66%
1 ene 2016 año
349.144 bn
-166.948 bn
-32.35%
Ranking de los países por los datos estadísticos actuales

Comentarios:

Enviar
PremiumAbout & FeedbackAcuerdoPrivacidad
logo
© 2022 Selected Technologies LLC – Morgan Hill, California