33
/es/
AIzaSyAYiBZKx7MnpbEhh9jyipgxe19OcubqV5w
August 1, 2025
224899
Poland
POL
true
2
1
Gross domestic savings (current LCU)
2016,2015,2014,2013,2012,2011,2010,2009,2008,2007,2006,2005,2004,2003,2002,2001,2000,1999,1998,1997,1996,1995,1994,1993,1992,1991
Download
Estadísticas Globales de la Biblioteca →Poland →

Gross domestic savings (current LCU)

Estas estadísticas en otros países:

AfghanistanAlbaniaAlgeriaAngolaAntigua and BarbudaArgentinaArmeniaArubaAustraliaAustriaAzerbaijanBahamas, TheBahrainBangladeshBarbadosBelarusBelgiumBelizeBeninBermudaBhutanBoliviaBosnia and HerzegovinaBotswanaBrazilBrunei DarussalamBulgariaBurkina FasoBurundiCabo VerdeCambodiaCameroonCanadaCentral African RepublicChadChileChinaColombiaComorosCongo, Dem. Rep.Congo, Rep.Costa RicaCote d'IvoireCroatiaCubaCyprusCzech RepublicDenmarkDjiboutiDominicaDominican RepublicEcuadorEgypt, Arab Rep.El SalvadorEquatorial GuineaEritreaEstoniaEthiopiaFaroe IslandsFijiFinlandFranceGabonGambia, TheGeorgiaGermanyGhanaGreeceGrenadaGuatemalaGuineaGuinea-BissauGuyanaHaitiHondurasHong Kong SAR, ChinaHungaryIcelandIndiaIndonesiaIran, Islamic Rep.IraqIrelandIsraelItalyJamaicaJapanJordanKazakhstanKenyaKiribatiKorea, Rep.KosovoKuwaitKyrgyz RepublicLao PDRLatviaLebanonLesothoLiberiaLibyaLithuaniaLuxembourgMacao SAR, ChinaMacedonia, FYRMadagascarMalawiMalaysiaMaldivesMaliMaltaMauritaniaMauritiusMexicoMicronesia, Fed. Sts.MoldovaMongoliaMontenegroMoroccoMozambiqueNamibiaNepalNetherlandsNew CaledoniaNew ZealandNicaraguaNigerNigeriaNorwayOmanPakistanPanamaPapua New GuineaParaguayPeruPhilippinesPolandPortugalPuerto RicoQatarRomaniaRussian FederationRwandaSaudi ArabiaSenegalSerbiaSeychellesSierra LeoneSingaporeSlovak RepublicSloveniaSolomon IslandsSomaliaSouth AfricaSouth SudanSpainSri LankaSt. Kitts and NevisSt. LuciaSt. Vincent and the GrenadinesSudanSurinameSwazilandSwedenSwitzerlandSyrian Arab RepublicTajikistanTanzaniaThailandTimor-LesteTogoTongaTrinidad and TobagoTunisiaTurkeyTurkmenistanUgandaUkraineUnited Arab EmiratesUnited KingdomUnited StatesUruguayUzbekistanVanuatuVenezuela, RBVietnamWest Bank and GazaYemen, Rep.ZambiaZimbabwe

línea de tiempo (timeline):

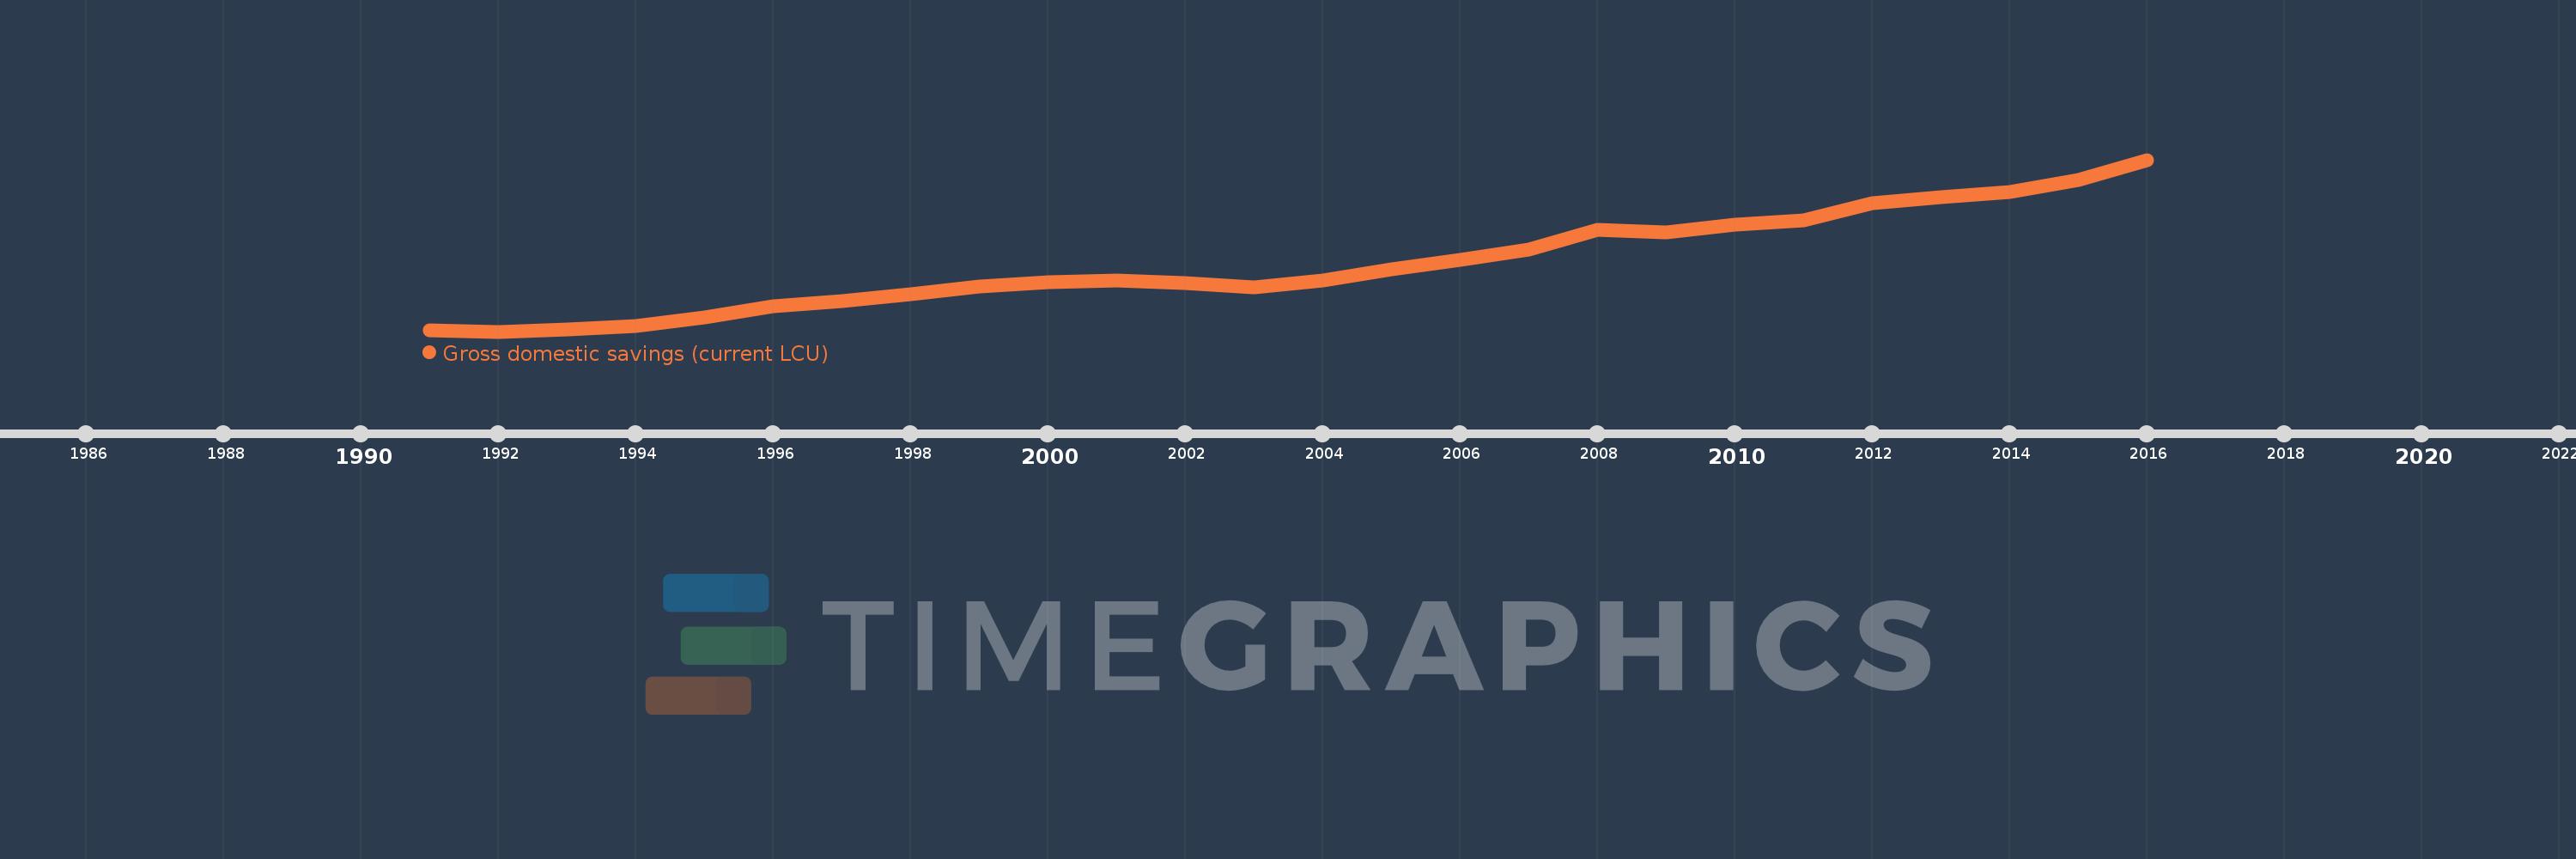
En esta escala de tiempo se presenta un gráfico de 1991 y 2016 de Poland. Los datos de 1990 están ausentes. El número de observaciones reales por fecha: 26.

Fuente (nombre):

Indicadores del desarrollo mundial

Fuente (organización):

World Bank national accounts data, and OECD National Accounts data files.

Categorías:

Economy & Growth

Se ha actualizado:

23 abr 2017 año

Los indicadores de los cambios de valor en los últimos años

En promedio:
177.279 bn
Mínimo:
16.537 bn
1 ene 1992 año
Máximo:
423.381 bn
1 ene 2016 año
A la fecha de observación
Valor
Cambio absoluto
El cambio con respecto al valor anterior
1 ene 1991 año
20.155 bn
+20.155 bn
0.0%
1 ene 1992 año
16.537 bn
-3.618 bn
-17.95%
1 ene 1993 año
21.413 bn
+4.876 bn
29.49%
1 ene 1994 año
28.803 bn
+7.39 bn
34.51%
1 ene 1995 año
49.49 bn
+20.687 bn
71.82%
1 ene 1996 año
75.559 bn
+26.069 bn
52.68%
1 ene 1997 año
88.051 bn
+12.492 bn
16.53%
1 ene 1998 año
104.083 bn
+16.032 bn
18.21%
1 ene 1999 año
124.154 bn
+20.071 bn
19.28%
1 ene 2000 año
132.578 bn
+8.424 bn
6.79%
1 ene 2001 año
136.7 bn
+4.122 bn
3.11%
1 ene 2002 año
132.147 bn
-4.553 bn
-3.33%
1 ene 2003 año
121.896 bn
-10.251 bn
-7.76%
1 ene 2004 año
136.847 bn
+14.951 bn
12.27%
1 ene 2005 año
163.725 bn
+26.878 bn
19.64%
1 ene 2006 año
186.698 bn
+22.973 bn
14.03%
1 ene 2007 año
210.038 bn
+23.34 bn
12.5%
1 ene 2008 año
257.412 bn
+47.374 bn
22.55%
1 ene 2009 año
252.269 bn
-5.143 bn
-2.0%
1 ene 2010 año
270.546 bn
+18.277 bn
7.25%
1 ene 2011 año
279.162 bn
+8.616 bn
3.18%
1 ene 2012 año
320.939 bn
+41.777 bn
14.97%
1 ene 2013 año
334.857 bn
+13.918 bn
4.34%
1 ene 2014 año
346.771 bn
+11.914 bn
3.56%
1 ene 2015 año
375.046 bn
+28.275 bn
8.15%
1 ene 2016 año
423.381 bn
+48.335 bn
12.89%

Ranking de los países por los datos estadísticos actuales