29
/es/
es
AIzaSyAYiBZKx7MnpbEhh9jyipgxe19OcubqV5w
April 1, 2024
225212
Poland
POL
true
2
1
Net taxes on products (current US$)
2016,2015,2014,2013,2012,2011,2010,2009,2008,2007,2006,2005,2004,2003,2002,2001,2000,1999,1998,1997,1996,1995,1994,1993,1992
Download
Estadísticas Globales de la Biblioteca →Poland →

Net taxes on products (current US$)

Estas estadísticas en otros países:
AfghanistanAlbaniaAlgeriaAndorraAntigua and BarbudaArgentinaArmeniaArubaAustraliaAustriaAzerbaijanBahamas, TheBahrainBangladeshBarbadosBelarusBelgiumBelizeBeninBermudaBhutanBoliviaBosnia and HerzegovinaBotswanaBrazilBulgariaBurkina FasoBurundiCabo VerdeCambodiaCameroonCanadaCentral African RepublicChadChileColombiaCongo, Dem. Rep.Costa RicaCroatiaCubaCyprusCzech RepublicDenmarkDjiboutiDominicaDominican RepublicEcuadorEgypt, Arab Rep.El SalvadorEquatorial GuineaEritreaEstoniaEthiopiaFaroe IslandsFijiFinlandFranceGabonGambia, TheGeorgiaGermanyGhanaGreeceGrenadaGuatemalaGuineaGuinea-BissauGuyanaHondurasHong Kong SAR, ChinaHungaryIndiaIndonesiaIran, Islamic Rep.IrelandItalyJamaicaJapanJordanKazakhstanKenyaKiribatiKorea, Rep.KosovoKyrgyz RepublicLao PDRLatviaLebanonLesothoLiberiaLiechtensteinLithuaniaLuxembourgMacao SAR, ChinaMacedonia, FYRMadagascarMalawiMalaysiaMaldivesMaliMarshall IslandsMauritaniaMauritiusMexicoMicronesia, Fed. Sts.MoldovaMongoliaMontenegroMoroccoMozambiqueNamibiaNepalNetherlandsNew ZealandNicaraguaNigerNigeriaNorwayOmanPakistanPalauPanamaPapua New GuineaParaguayPeruPolandPortugalRomaniaRussian FederationRwandaSao Tome and PrincipeSenegalSerbiaSeychellesSierra LeoneSingaporeSlovak RepublicSloveniaSolomon IslandsSouth AfricaSpainSri LankaSt. Kitts and NevisSt. LuciaSt. Vincent and the GrenadinesSudanSurinameSwazilandSwedenSwitzerlandSyrian Arab RepublicTajikistanTanzaniaThailandTimor-LesteTongaTrinidad and TobagoTunisiaTurkeyTurkmenistanTuvaluUgandaUkraineUnited KingdomUnited StatesUruguayUzbekistanVanuatuVenezuela, RBVietnamWest Bank and GazaYemen, Rep.ZambiaZimbabwe
línea de tiempo (timeline):
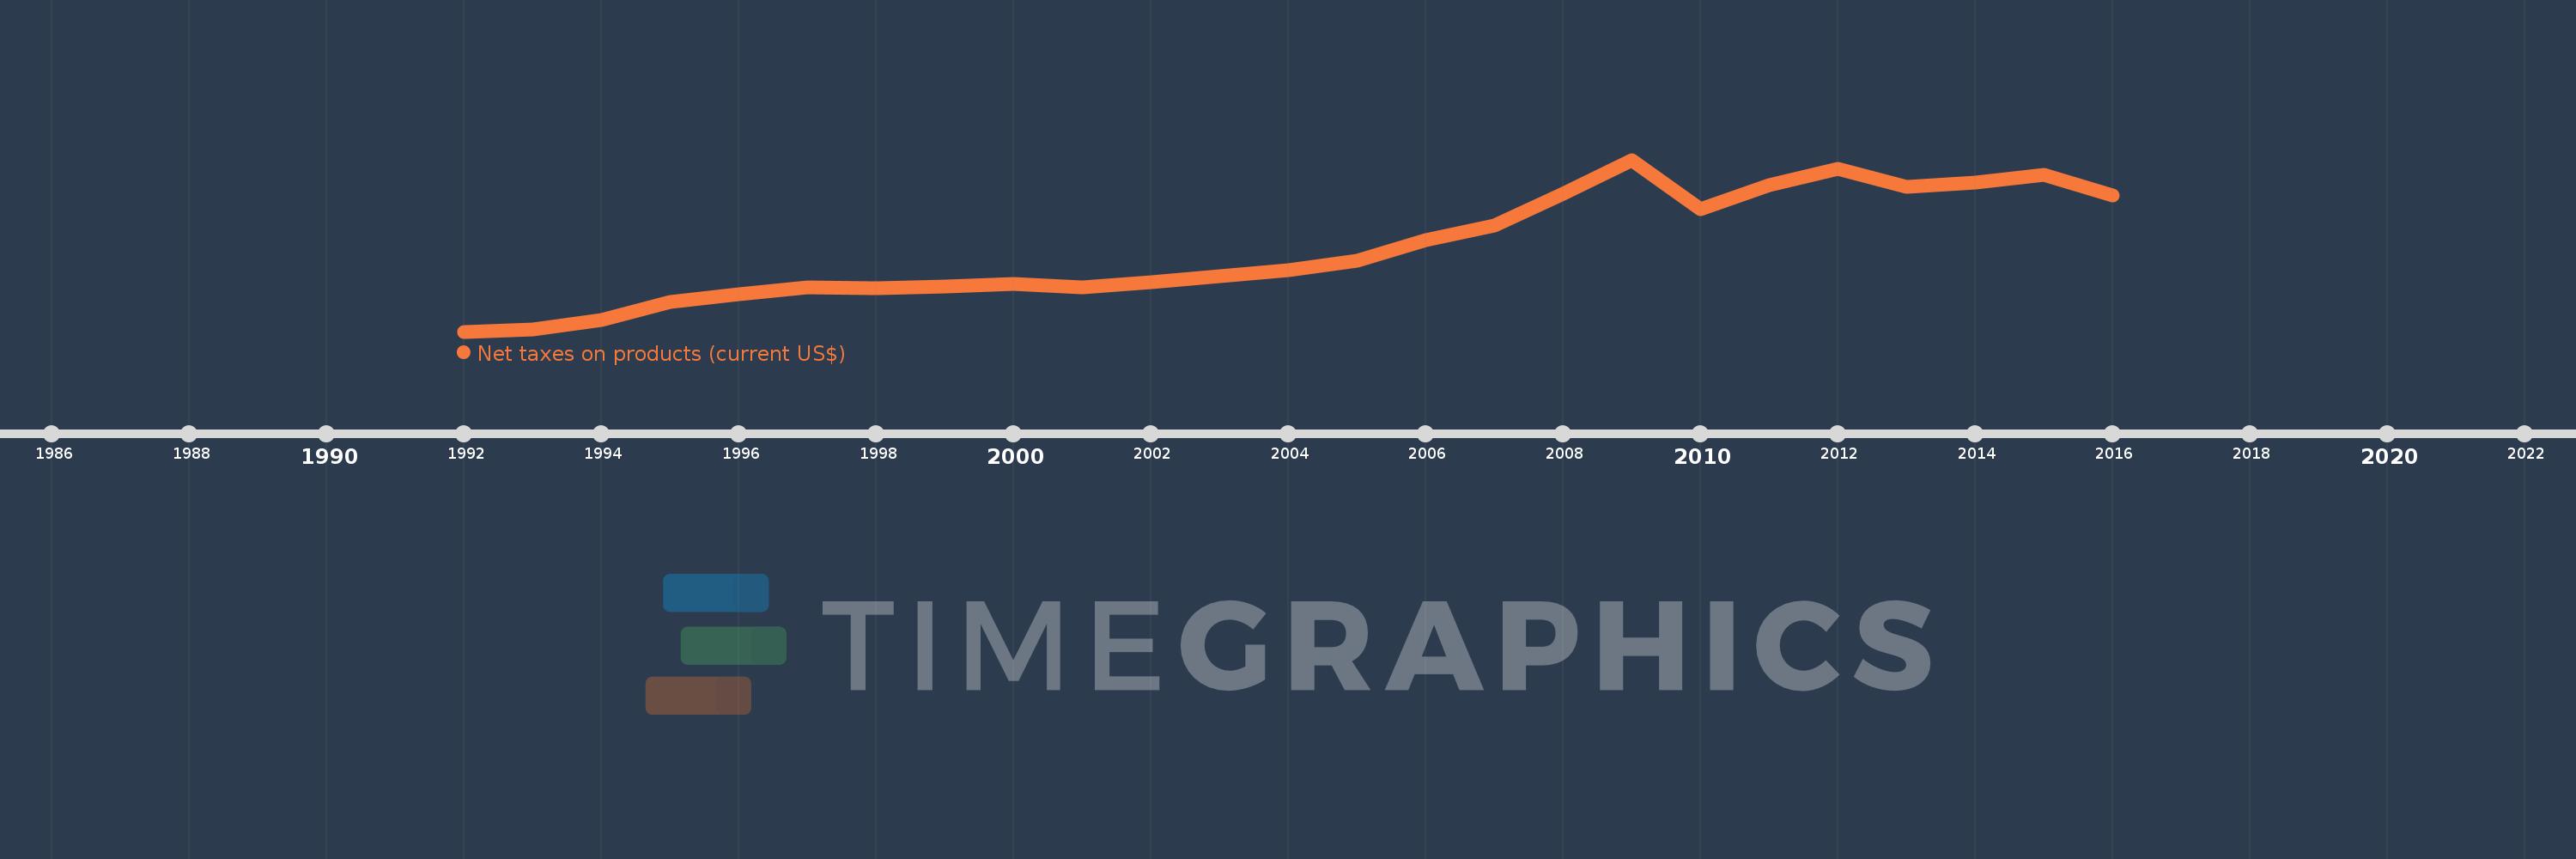
En esta escala de tiempo se presenta un gráfico de 1992 y 2016 de Poland. Los datos de 1991 están ausentes. El número de observaciones reales por fecha: 25.
Fuente (nombre):
Indicadores del desarrollo mundial
Fuente (organización):
World Bank national accounts data, and OECD National Accounts data files.
Categorías:
Economy & Growth
Se ha actualizado:
23 abr 2017 año
Los indicadores de los cambios de valor en los últimos años
En promedio:
33.793 bn
Mínimo:
2.592 bn
1 ene 1992 año
Máximo:
67.346 bn
1 ene 2009 año
A la fecha de observación
Valor
Cambio absoluto
El cambio con respecto al valor anterior
1 ene 1992 año
2.592 bn
+2.592 bn
0.0%
1 ene 1993 año
3.512 bn
+919.814 millones
35.48%
1 ene 1994 año
6.852 bn
+3.34 bn
95.09%
1 ene 1995 año
13.804 bn
+6.952 bn
101.45%
1 ene 1996 año
16.783 bn
+2.979 bn
21.58%
1 ene 1997 año
19.27 bn
+2.487 bn
14.82%
1 ene 1998 año
18.795 bn
-475.192 millones
-2.47%
1 ene 1999 año
19.728 bn
+932.936 millones
4.96%
1 ene 2000 año
20.471 bn
+742.82 millones
3.77%
1 ene 2001 año
19.365 bn
-1.106 bn
-5.4%
1 ene 2002 año
21.185 bn
+1.82 bn
9.4%
1 ene 2003 año
23.443 bn
+2.258 bn
10.66%
1 ene 2004 año
25.897 bn
+2.454 bn
10.47%
1 ene 2005 año
29.45 bn
+3.553 bn
13.72%
1 ene 2006 año
37.126 bn
+7.676 bn
26.07%
1 ene 2007 año
42.61 bn
+5.483 bn
14.77%
1 ene 2008 año
54.621 bn
+12.011 bn
28.19%
1 ene 2009 año
67.346 bn
+12.725 bn
23.3%
1 ene 2010 año
48.752 bn
-18.594 bn
-27.61%
1 ene 2011 año
57.647 bn
+8.895 bn
18.25%
1 ene 2012 año
64.08 bn
+6.434 bn
11.16%
1 ene 2013 año
57.045 bn
-7.036 bn
-10.98%
1 ene 2014 año
58.842 bn
+1.798 bn
3.15%
1 ene 2015 año
61.742 bn
+2.899 bn
4.93%
1 ene 2016 año
53.86 bn
-7.881 bn
-12.77%
Ranking de los países por los datos estadísticos actuales

Comentarios:

Enviar
PremiumAbout & FeedbackAcuerdoPrivacidad
logo
© 2022 Selected Technologies LLC – Morgan Hill, California