29
/es/
es
AIzaSyAYiBZKx7MnpbEhh9jyipgxe19OcubqV5w
April 1, 2024
152891
Hungary
HUN
true
2
1
Net taxes on products (current US$)
2016,2015,2014,2013,2012,2011,2010,2009,2008,2007,2006,2005,2004,2003,2002,2001,2000,1999,1998,1997,1996,1995,1994,1993,1992
Download
Estadísticas Globales de la Biblioteca →Hungary →

Net taxes on products (current US$)

Estas estadísticas en otros países:
AfghanistanAlbaniaAlgeriaAndorraAntigua and BarbudaArgentinaArmeniaArubaAustraliaAustriaAzerbaijanBahamas, TheBahrainBangladeshBarbadosBelarusBelgiumBelizeBeninBermudaBhutanBoliviaBosnia and HerzegovinaBotswanaBrazilBulgariaBurkina FasoBurundiCabo VerdeCambodiaCameroonCanadaCentral African RepublicChadChileColombiaCongo, Dem. Rep.Costa RicaCroatiaCubaCyprusCzech RepublicDenmarkDjiboutiDominicaDominican RepublicEcuadorEgypt, Arab Rep.El SalvadorEquatorial GuineaEritreaEstoniaEthiopiaFaroe IslandsFijiFinlandFranceGabonGambia, TheGeorgiaGermanyGhanaGreeceGrenadaGuatemalaGuineaGuinea-BissauGuyanaHondurasHong Kong SAR, ChinaHungaryIndiaIndonesiaIran, Islamic Rep.IrelandItalyJamaicaJapanJordanKazakhstanKenyaKiribatiKorea, Rep.KosovoKyrgyz RepublicLao PDRLatviaLebanonLesothoLiberiaLiechtensteinLithuaniaLuxembourgMacao SAR, ChinaMacedonia, FYRMadagascarMalawiMalaysiaMaldivesMaliMarshall IslandsMauritaniaMauritiusMexicoMicronesia, Fed. Sts.MoldovaMongoliaMontenegroMoroccoMozambiqueNamibiaNepalNetherlandsNew ZealandNicaraguaNigerNigeriaNorwayOmanPakistanPalauPanamaPapua New GuineaParaguayPeruPolandPortugalRomaniaRussian FederationRwandaSao Tome and PrincipeSenegalSerbiaSeychellesSierra LeoneSingaporeSlovak RepublicSloveniaSolomon IslandsSouth AfricaSpainSri LankaSt. Kitts and NevisSt. LuciaSt. Vincent and the GrenadinesSudanSurinameSwazilandSwedenSwitzerlandSyrian Arab RepublicTajikistanTanzaniaThailandTimor-LesteTongaTrinidad and TobagoTunisiaTurkeyTurkmenistanTuvaluUgandaUkraineUnited KingdomUnited StatesUruguayUzbekistanVanuatuVenezuela, RBVietnamWest Bank and GazaYemen, Rep.ZambiaZimbabwe
línea de tiempo (timeline):
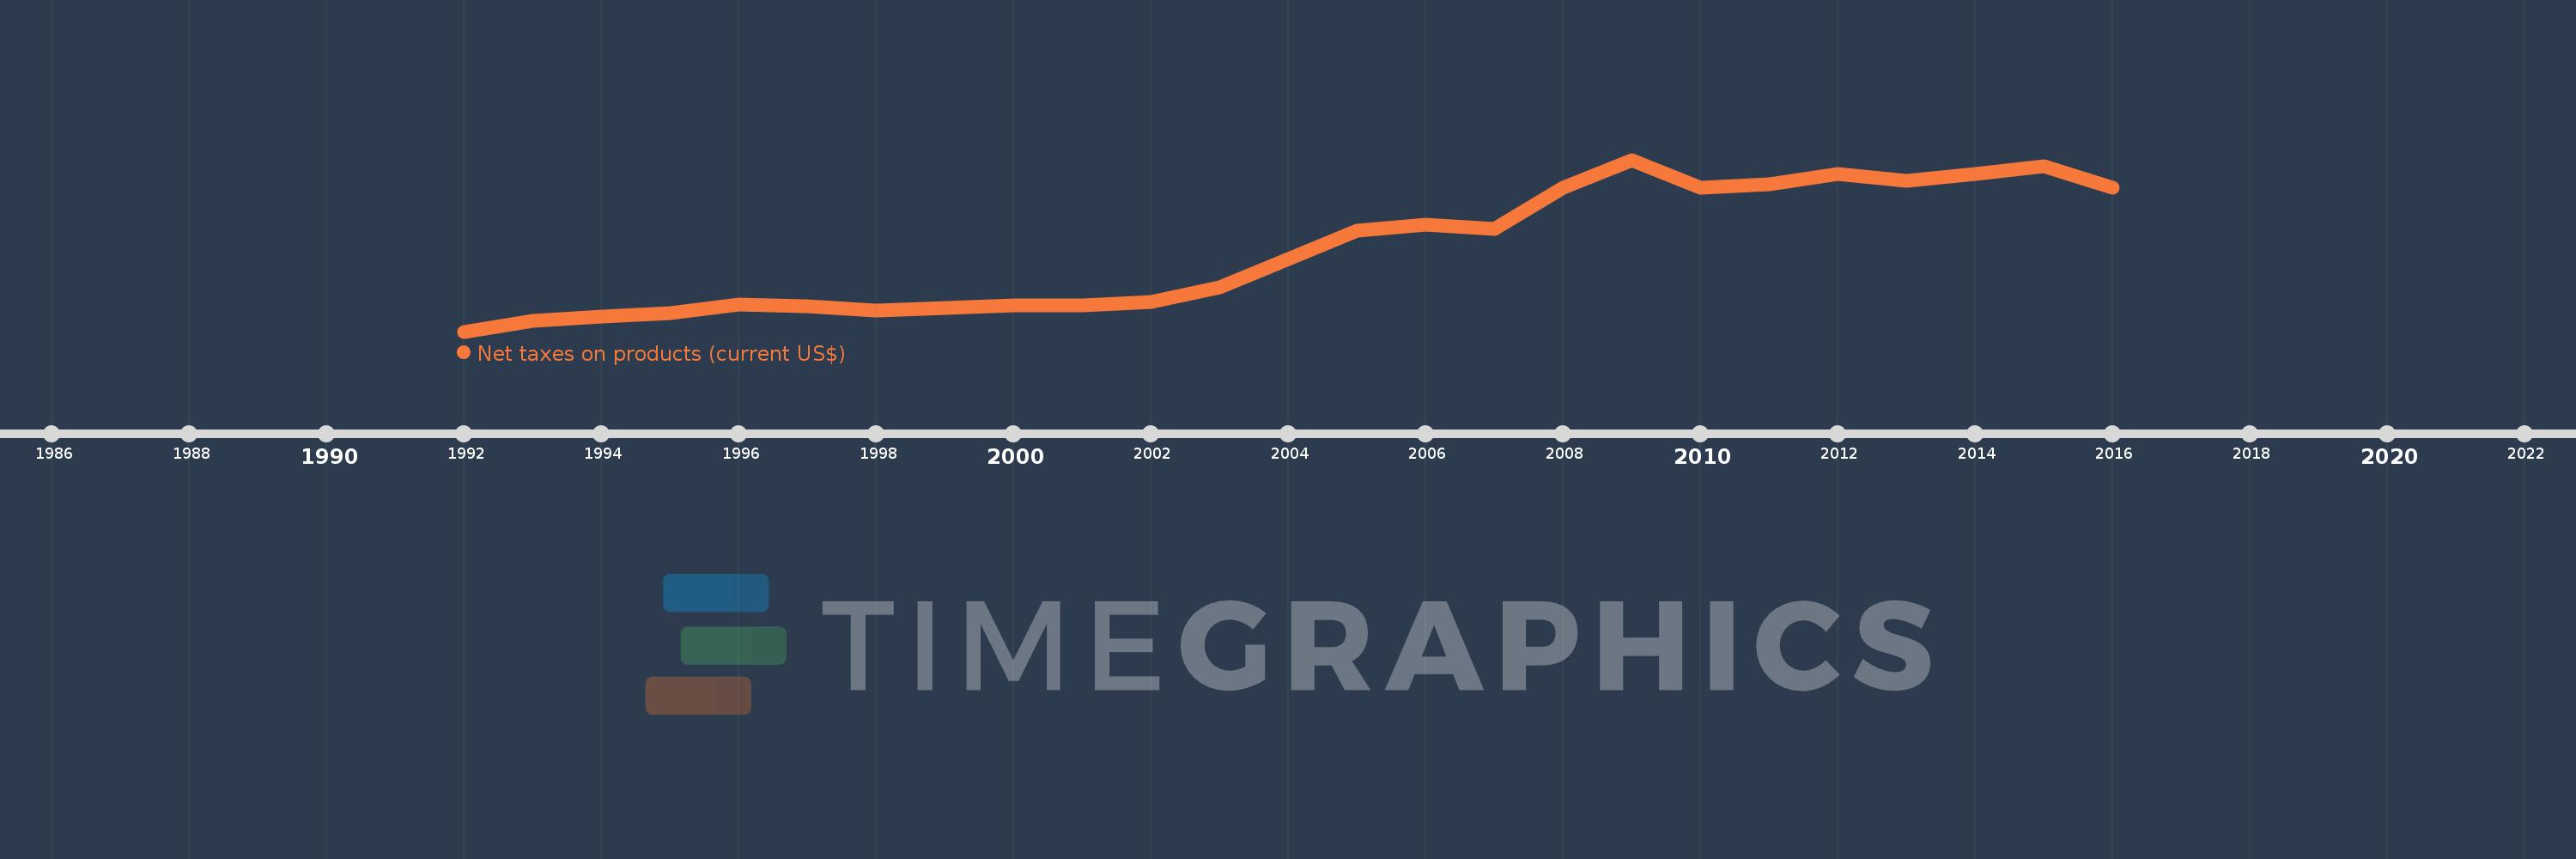
En esta escala de tiempo se presenta un gráfico de 1992 y 2016 de Hungary. Los datos de 1991 están ausentes. El número de observaciones reales por fecha: 25.
Fuente (nombre):
Indicadores del desarrollo mundial
Fuente (organización):
World Bank national accounts data, and OECD National Accounts data files.
Categorías:
Economy & Growth
Se ha actualizado:
23 abr 2017 año
Los indicadores de los cambios de valor en los últimos años
En promedio:
12.891 bn
Mínimo:
4.112 bn
1 ene 1992 año
Máximo:
22.657 bn
1 ene 2009 año
A la fecha de observación
Valor
Cambio absoluto
El cambio con respecto al valor anterior
1 ene 1992 año
4.112 bn
+4.112 bn
0.0%
1 ene 1993 año
5.309 bn
+1.197 bn
29.12%
1 ene 1994 año
5.773 bn
+464.272 millones
8.75%
1 ene 1995 año
6.135 bn
+361.773 millones
6.27%
1 ene 1996 año
7.073 bn
+938.08 millones
15.29%
1 ene 1997 año
6.814 bn
-259.118 millones
-3.66%
1 ene 1998 año
6.402 bn
-411.782 millones
-6.04%
1 ene 1999 año
6.678 bn
+276.035 millones
4.31%
1 ene 2000 año
6.927 bn
+248.672 millones
3.72%
1 ene 2001 año
6.925 bn
-1.146 millones
-0.02%
1 ene 2002 año
7.274 bn
+348.619 millones
5.03%
1 ene 2003 año
8.899 bn
+1.625 bn
22.34%
1 ene 2004 año
11.987 bn
+3.088 bn
34.7%
1 ene 2005 año
15.021 bn
+3.034 bn
25.31%
1 ene 2006 año
15.657 bn
+635.859 millones
4.23%
1 ene 2007 año
15.177 bn
-479.831 millones
-3.06%
1 ene 2008 año
19.597 bn
+4.421 bn
29.13%
1 ene 2009 año
22.657 bn
+3.059 bn
15.61%
1 ene 2010 año
19.599 bn
-3.058 bn
-13.5%
1 ene 2011 año
20.057 bn
+458.028 millones
2.34%
1 ene 2012 año
21.121 bn
+1.064 bn
5.31%
1 ene 2013 año
20.39 bn
-731.154 millones
-3.46%
1 ene 2014 año
21.135 bn
+744.891 millones
3.65%
1 ene 2015 año
21.916 bn
+781.599 millones
3.7%
1 ene 2016 año
19.639 bn
-2.277 bn
-10.39%
Ranking de los países por los datos estadísticos actuales

Comentarios:

Enviar
PremiumAbout & FeedbackAcuerdoPrivacidad
logo
© 2022 Selected Technologies LLC – Morgan Hill, California