29
/es/
es
AIzaSyAYiBZKx7MnpbEhh9jyipgxe19OcubqV5w
April 1, 2024
224561
Poland
POL
true
2
1
All education staff compensation, total (% of total expenditure in public institutions)
2013,2012,2011,2010,2009,2008,2007,2006,2005,2004,2003,2002,2001,2000,1999
Download
Estadísticas Globales de la Biblioteca →Poland →

All education staff compensation, total (% of total expenditure in public institutions)

Estas estadísticas en otros países:
AfghanistanAlbaniaAndorraAntigua and BarbudaArgentinaArmeniaArubaAustraliaAustriaAzerbaijanBahrainBangladeshBarbadosBelarusBelgiumBelizeBeninBoliviaBrazilBritish Virgin IslandsBulgariaBurkina FasoBurundiCabo VerdeCameroonCanadaCaribbean small statesCayman IslandsCentral African RepublicCentral Europe and the BalticsChileChinaColombiaComorosCongo, Dem. Rep.Cote d'IvoireCroatiaCubaCuracaoCyprusCzech RepublicDenmarkDjiboutiDominicaDominican RepublicEcuadorEl SalvadorEritreaEstoniaEthiopiaEuro areaEurope & Central AsiaEurope & Central Asia (excluding high income)Europe & Central Asia (IDA & IBRD countries)European UnionFijiFinlandFranceGambia, TheGermanyGhanaGreeceGrenadaGuatemalaGuineaGuinea-BissauGuyanaHigh incomeHondurasHungaryIcelandIndiaIndonesiaIrelandIsraelItalyJamaicaJapanJordanKazakhstanKorea, Rep.KuwaitKyrgyz RepublicLate-demographic dividendLatin America & Caribbean Latin America & Caribbean (excluding high income)Latin America & the Caribbean (IDA & IBRD countries)LatviaLebanonLesothoLiberiaLiechtensteinLithuaniaLuxembourgMacao SAR, ChinaMacedonia, FYRMadagascarMalawiMalaysiaMaliMaltaMarshall IslandsMexicoMoldovaMonacoMongoliaMoroccoMozambiqueNamibiaNauruNetherlandsNicaraguaNigerNorth AmericaNorwayOECD membersOmanPakistanPanamaParaguayPeruPhilippinesPolandPortugalPost-demographic dividendPuerto RicoQatarRomaniaRussian FederationRwandaSan MarinoSenegalSerbiaSeychellesSierra LeoneSlovak RepublicSloveniaSouth AfricaSpainSri LankaSt. Kitts and NevisSt. LuciaSt. Vincent and the GrenadinesSwedenSwitzerlandThailandTimor-LesteTogoTunisiaTurkeyTurks and Caicos IslandsUgandaUkraineUnited KingdomUnited StatesUruguayVanuatuVenezuela, RBVietnamWest Bank and GazaZambia
línea de tiempo (timeline):
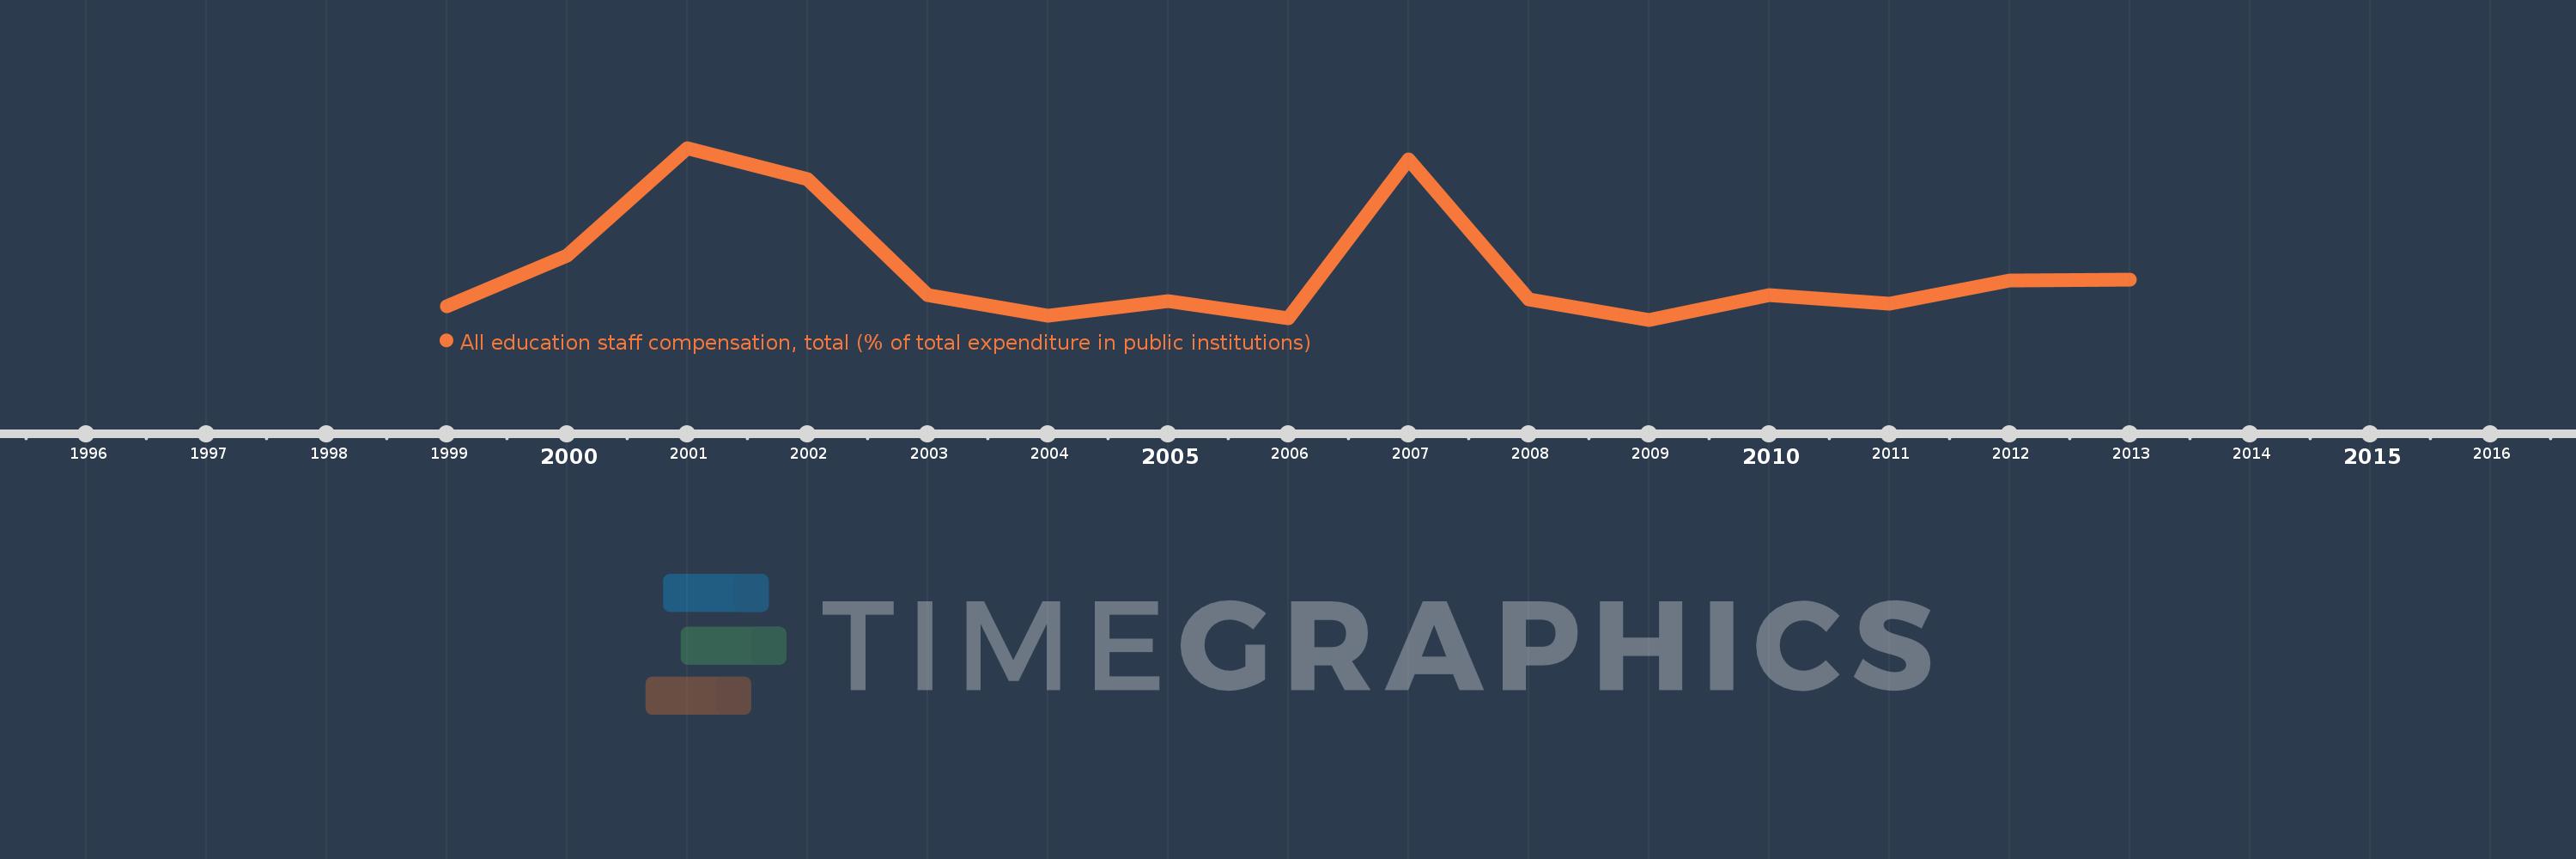
En esta escala de tiempo se presenta un gráfico de 1999 y 2013 de Poland. Los datos de 1998 están ausentes. El número de observaciones reales por fecha: 15.
Fuente (nombre):
Indicadores del desarrollo mundial
Fuente (organización):
United Nations Educational, Scientific, and Cultural Organization (UNESCO) Institute for Statistics.
Categorías:
Education
Se ha actualizado:
23 abr 2017 año
Los indicadores de los cambios de valor en los últimos años
En promedio:
63.265
Mínimo:
60.412
1 ene 2009 año
Máximo:
70.345
1 ene 2001 año
A la fecha de observación
Valor
Cambio absoluto
El cambio con respecto al valor anterior
1 ene 1999 año
61.198
+61.198
0.0%
1 ene 2000 año
64.137
+2.939
4.8%
1 ene 2001 año
70.345
+6.209
9.68%
1 ene 2002 año
68.552
-1.794
-2.55%
1 ene 2003 año
61.814
-6.737
-9.83%
1 ene 2004 año
60.653
-1.161
-1.88%
1 ene 2005 año
61.492
+0.838
1.38%
1 ene 2006 año
60.492
-0.999
-1.62%
1 ene 2007 año
69.695
+9.203
15.21%
1 ene 2008 año
61.574
-8.121
-11.65%
1 ene 2009 año
60.412
-1.161
-1.89%
1 ene 2010 año
61.836
+1.424
2.36%
1 ene 2011 año
61.354
-0.482
-0.78%
1 ene 2012 año
62.684
+1.329
2.17%
1 ene 2013 año
62.739
+0.055
0.09%
Ranking de los países por los datos estadísticos actuales

Comentarios:

Enviar
PremiumAbout & FeedbackAcuerdoPrivacidad
logo
© 2022 Selected Technologies LLC – Morgan Hill, California