29
/es/
es
AIzaSyAYiBZKx7MnpbEhh9jyipgxe19OcubqV5w
April 1, 2024
152244
Hungary
HUN
true
2
1
All education staff compensation, total (% of total expenditure in public institutions)
2012,2011,2010,2009,2008,2007,2006,2005,2004,2003,2002,2001,2000,1999
Download
Estadísticas Globales de la Biblioteca →Hungary →

All education staff compensation, total (% of total expenditure in public institutions)

Estas estadísticas en otros países:
AfghanistanAlbaniaAndorraAntigua and BarbudaArgentinaArmeniaArubaAustraliaAustriaAzerbaijanBahrainBangladeshBarbadosBelarusBelgiumBelizeBeninBoliviaBrazilBritish Virgin IslandsBulgariaBurkina FasoBurundiCabo VerdeCameroonCanadaCaribbean small statesCayman IslandsCentral African RepublicCentral Europe and the BalticsChileChinaColombiaComorosCongo, Dem. Rep.Cote d'IvoireCroatiaCubaCuracaoCyprusCzech RepublicDenmarkDjiboutiDominicaDominican RepublicEcuadorEl SalvadorEritreaEstoniaEthiopiaEuro areaEurope & Central AsiaEurope & Central Asia (excluding high income)Europe & Central Asia (IDA & IBRD countries)European UnionFijiFinlandFranceGambia, TheGermanyGhanaGreeceGrenadaGuatemalaGuineaGuinea-BissauGuyanaHigh incomeHondurasHungaryIcelandIndiaIndonesiaIrelandIsraelItalyJamaicaJapanJordanKazakhstanKorea, Rep.KuwaitKyrgyz RepublicLate-demographic dividendLatin America & Caribbean Latin America & Caribbean (excluding high income)Latin America & the Caribbean (IDA & IBRD countries)LatviaLebanonLesothoLiberiaLiechtensteinLithuaniaLuxembourgMacao SAR, ChinaMacedonia, FYRMadagascarMalawiMalaysiaMaliMaltaMarshall IslandsMexicoMoldovaMonacoMongoliaMoroccoMozambiqueNamibiaNauruNetherlandsNicaraguaNigerNorth AmericaNorwayOECD membersOmanPakistanPanamaParaguayPeruPhilippinesPolandPortugalPost-demographic dividendPuerto RicoQatarRomaniaRussian FederationRwandaSan MarinoSenegalSerbiaSeychellesSierra LeoneSlovak RepublicSloveniaSouth AfricaSpainSri LankaSt. Kitts and NevisSt. LuciaSt. Vincent and the GrenadinesSwedenSwitzerlandThailandTimor-LesteTogoTunisiaTurkeyTurks and Caicos IslandsUgandaUkraineUnited KingdomUnited StatesUruguayVanuatuVenezuela, RBVietnamWest Bank and GazaZambia
línea de tiempo (timeline):
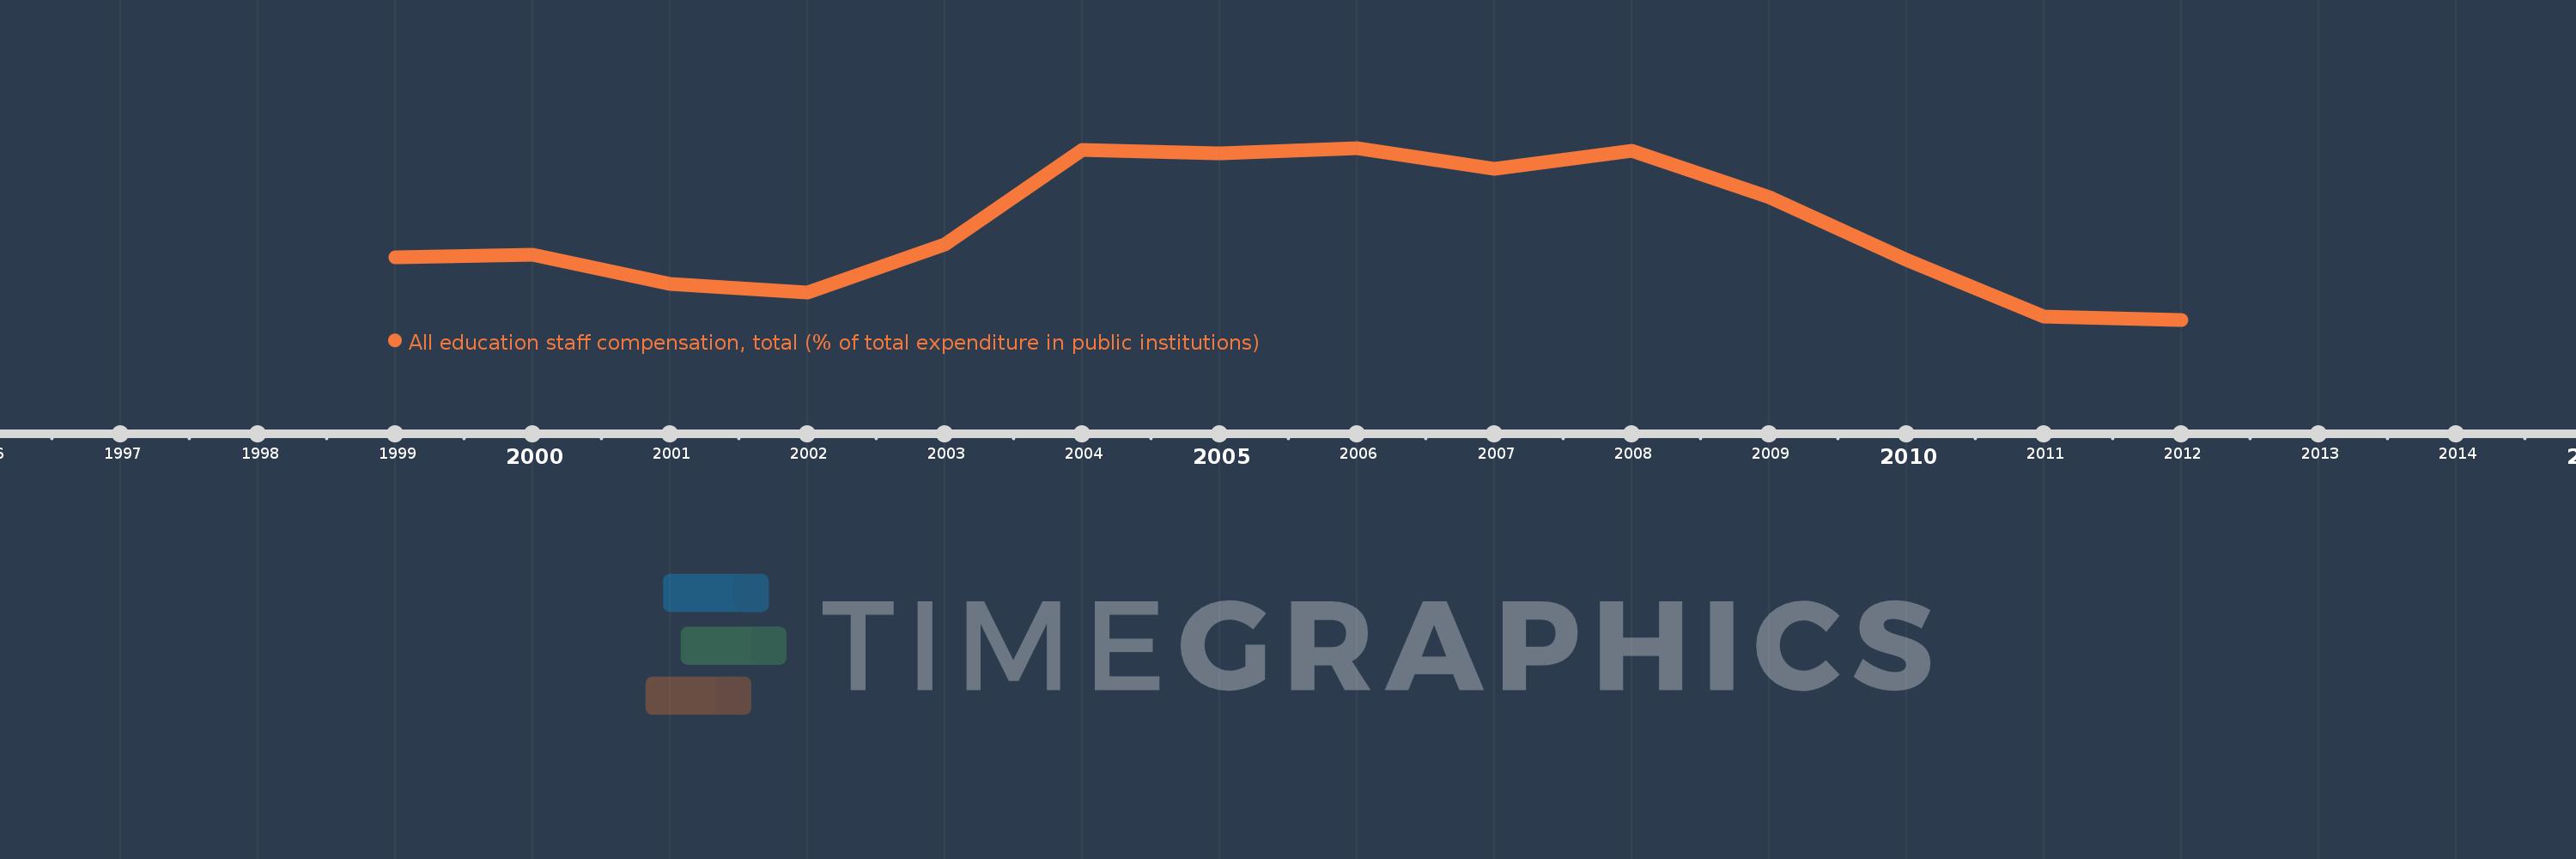
En esta escala de tiempo se presenta un gráfico de 1999 y 2012 de Hungary. Los datos de 1998 están ausentes. El número de observaciones reales por fecha: 14.
Fuente (nombre):
Indicadores del desarrollo mundial
Fuente (organización):
United Nations Educational, Scientific, and Cultural Organization (UNESCO) Institute for Statistics.
Categorías:
Education
Se ha actualizado:
23 abr 2017 año
Los indicadores de los cambios de valor en los últimos años
En promedio:
67.279
Mínimo:
62.319
1 ene 2012 año
Máximo:
71.642
1 ene 2006 año
A la fecha de observación
Valor
Cambio absoluto
El cambio con respecto al valor anterior
1 ene 1999 año
65.711
+65.711
0.0%
1 ene 2000 año
65.87
+0.159
0.24%
1 ene 2001 año
64.261
-1.609
-2.44%
1 ene 2002 año
63.782
-0.479
-0.75%
1 ene 2003 año
66.39
+2.608
4.09%
1 ene 2004 año
71.517
+5.126
7.72%
1 ene 2005 año
71.355
-0.161
-0.23%
1 ene 2006 año
71.642
+0.287
0.4%
1 ene 2007 año
70.494
-1.148
-1.6%
1 ene 2008 año
71.508
+1.013
1.44%
1 ene 2009 año
68.971
-2.537
-3.55%
1 ene 2010 año
65.59
-3.381
-4.9%
1 ene 2011 año
62.498
-3.091
-4.71%
1 ene 2012 año
62.319
-0.18
-0.29%
Ranking de los países por los datos estadísticos actuales

Comentarios:

Enviar
PremiumAbout & FeedbackAcuerdoPrivacidad
logo
© 2022 Selected Technologies LLC – Morgan Hill, California