29
/es/
es
AIzaSyAYiBZKx7MnpbEhh9jyipgxe19OcubqV5w
April 1, 2024
220523
Paraguay
PRY
true
2
1
Changes in inventories (current LCU)
2016,2015,2014,2013,2012,2011,2010,2009,2008,2007,2006,2005,2004,2003,2002,2001,2000,1999,1998,1997,1996,1995,1994,1993,1992
Download
Estadísticas Globales de la Biblioteca →Paraguay →

Changes in inventories (current LCU)

Estas estadísticas en otros países:
AlbaniaAlgeriaAngolaAntigua and BarbudaArgentinaArmeniaArubaAustraliaAustriaAzerbaijanBahamas, TheBahrainBarbadosBelarusBelgiumBelizeBeninBermudaBhutanBoliviaBosnia and HerzegovinaBotswanaBrazilBrunei DarussalamBulgariaBurkina FasoBurundiCabo VerdeCambodiaCameroonCanadaCentral African RepublicChadChileChinaColombiaComorosCongo, Dem. Rep.Congo, Rep.Costa RicaCote d'IvoireCroatiaCubaCyprusCzech RepublicDenmarkDjiboutiDominicaDominican RepublicEcuadorEgypt, Arab Rep.El SalvadorEquatorial GuineaEritreaEstoniaEthiopiaFijiFinlandFranceGabonGambia, TheGeorgiaGermanyGhanaGreeceGrenadaGuatemalaGuineaGuinea-BissauGuyanaHondurasHong Kong SAR, ChinaHungaryIcelandIndiaIndonesiaIran, Islamic Rep.IraqIrelandIsraelItalyJamaicaJapanJordanKazakhstanKenyaKiribatiKorea, Rep.KosovoKuwaitKyrgyz RepublicLao PDRLatviaLebanonLesothoLiberiaLibyaLithuaniaLuxembourgMacao SAR, ChinaMacedonia, FYRMadagascarMalawiMalaysiaMaldivesMaliMaltaMauritaniaMauritiusMexicoMicronesia, Fed. Sts.MoldovaMongoliaMontenegroMoroccoMozambiqueNamibiaNepalNetherlandsNew CaledoniaNew ZealandNicaraguaNigerNigeriaNorwayOmanPakistanPanamaPapua New GuineaParaguayPeruPhilippinesPolandPortugalPuerto RicoQatarRomaniaRussian FederationRwandaSaudi ArabiaSenegalSerbiaSeychellesSierra LeoneSingaporeSlovak RepublicSloveniaSolomon IslandsSomaliaSouth AfricaSouth SudanSpainSri LankaSt. Kitts and NevisSt. LuciaSt. Vincent and the GrenadinesSudanSurinameSwazilandSwedenSwitzerlandSyrian Arab RepublicTajikistanTanzaniaThailandTimor-LesteTogoTongaTrinidad and TobagoTunisiaTurkeyTurkmenistanUgandaUkraineUnited Arab EmiratesUnited KingdomUnited StatesUruguayVanuatuVenezuela, RBVietnamWest Bank and GazaYemen, Rep.ZambiaZimbabwe
línea de tiempo (timeline):
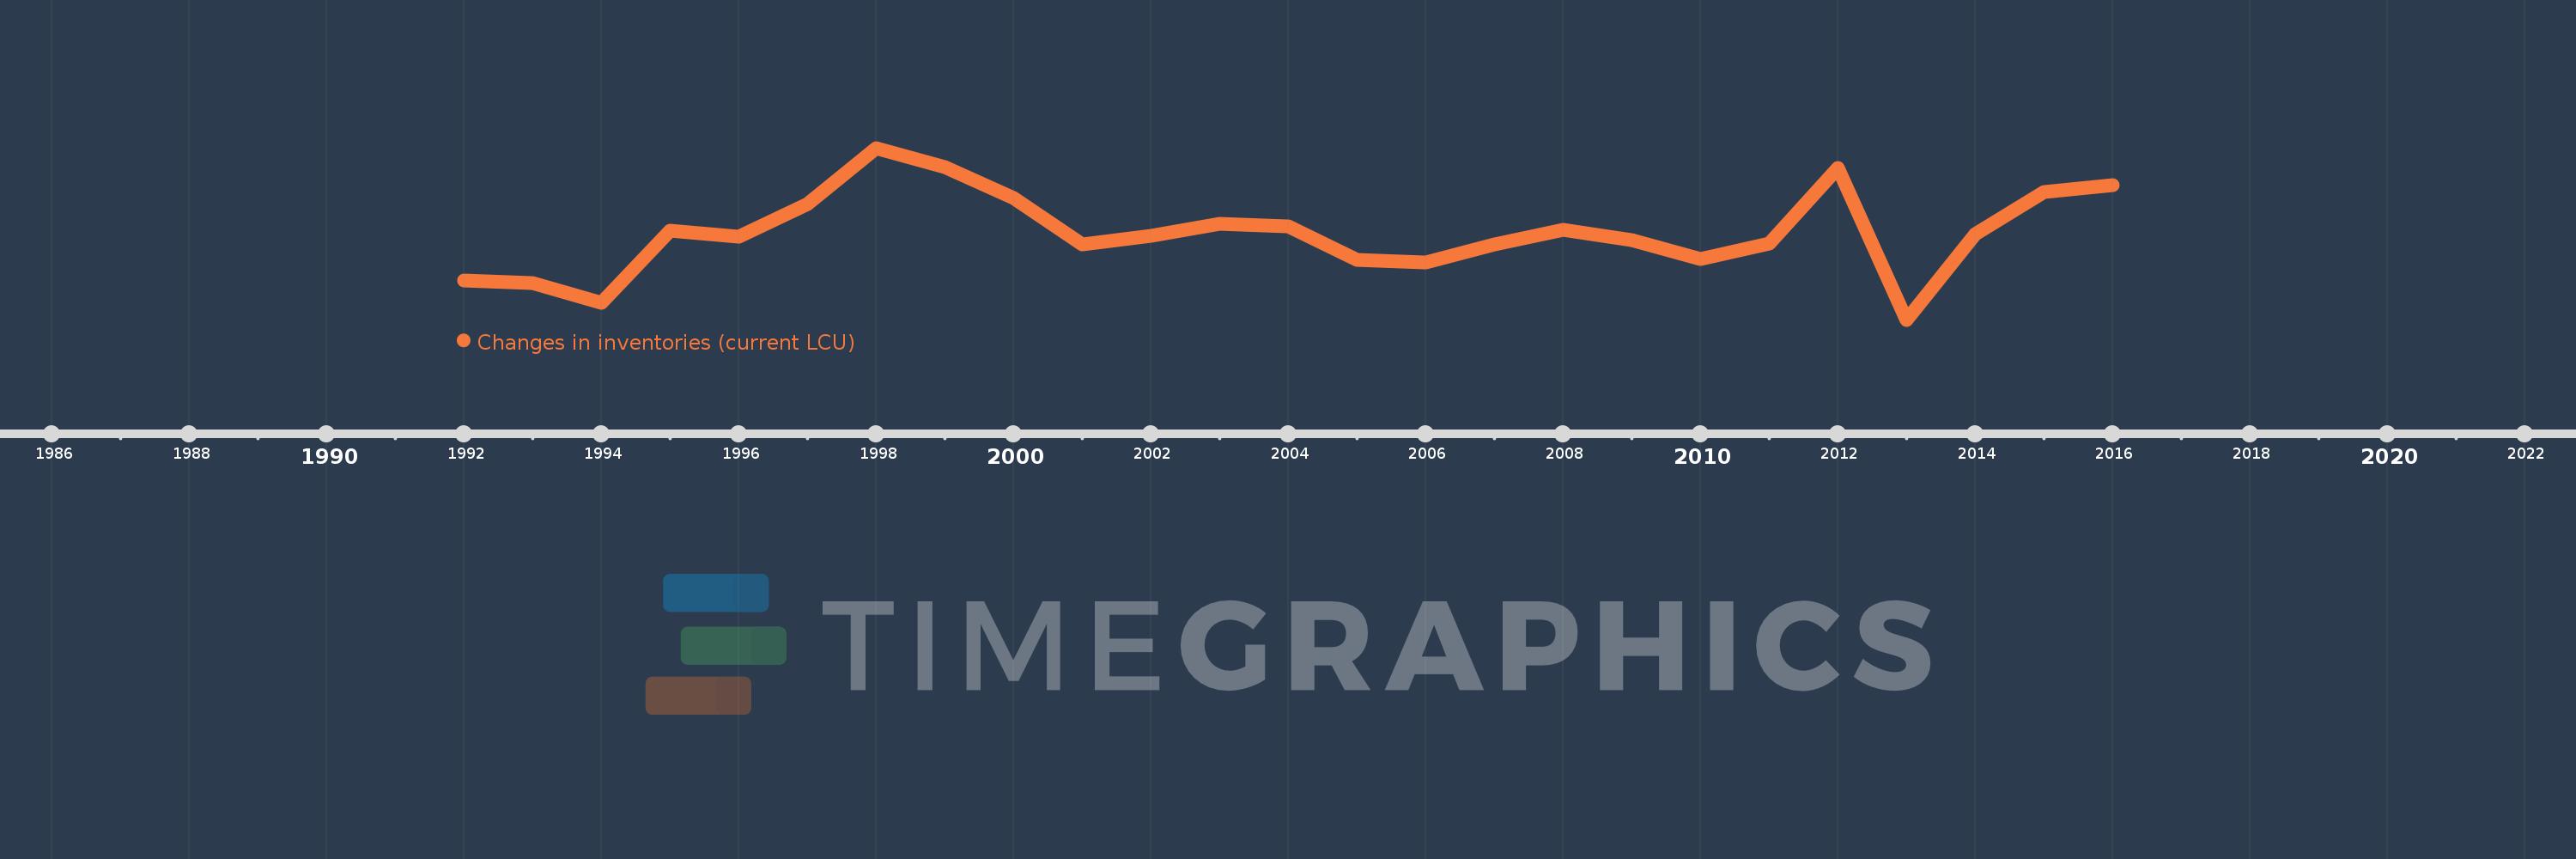
En esta escala de tiempo se presenta un gráfico de 1992 y 2016 de Paraguay. Los datos de 1991 están ausentes. El número de observaciones reales por fecha: 25.
Fuente (nombre):
Indicadores del desarrollo mundial
Fuente (organización):
World Bank national accounts data, and OECD National Accounts data files.
Categorías:
Economy & Growth
Se ha actualizado:
23 abr 2017 año
Los indicadores de los cambios de valor en los últimos años
En promedio:
373.916 bn
Mínimo:
-75.322 bn
1 ene 2013 año
Máximo:
813.159 bn
1 ene 1998 año
A la fecha de observación
Valor
Cambio absoluto
El cambio con respecto al valor anterior
1 ene 1992 año
125.898 bn
+125.898 bn
0.0%
1 ene 1993 año
112.623 bn
-13.275 bn
-10.54%
1 ene 1994 año
10.637 bn
-101.986 bn
-90.56%
1 ene 1995 año
387.03 bn
+376.393 bn
3.54 mil%
1 ene 1996 año
354.438 bn
-32.592 bn
-8.42%
1 ene 1997 año
524.332 bn
+169.894 bn
47.93%
1 ene 1998 año
813.159 bn
+288.827 bn
55.08%
1 ene 1999 año
713.906 bn
-99.253 bn
-12.21%
1 ene 2000 año
555.527 bn
-158.379 bn
-22.18%
1 ene 2001 año
314.044 bn
-241.483 bn
-43.47%
1 ene 2002 año
356.76 bn
+42.716 bn
13.6%
1 ene 2003 año
419.765 bn
+63.005 bn
17.66%
1 ene 2004 año
407.765 bn
-12.0 bn
-2.86%
1 ene 2005 año
234.648 bn
-173.117 bn
-42.46%
1 ene 2006 año
218.875 bn
-15.773 bn
-6.72%
1 ene 2007 año
312.149 bn
+93.274 bn
42.62%
1 ene 2008 año
388.567 bn
+76.418 bn
24.48%
1 ene 2009 año
334.388 bn
-54.179 bn
-13.94%
1 ene 2010 año
236.751 bn
-97.637 bn
-29.2%
1 ene 2011 año
317.575 bn
+80.824 bn
34.14%
1 ene 2012 año
710.314 bn
+392.739 bn
123.67%
1 ene 2013 año
-75.322 bn
-785.636 bn
-110.6%
1 ene 2014 año
369.643 bn
+444.965 bn
-590.75%
1 ene 2015 año
584.673 bn
+215.03 bn
58.17%
1 ene 2016 año
619.754 bn
+35.08 bn
6.0%
Ranking de los países por los datos estadísticos actuales

Comentarios:

Enviar
PremiumAbout & FeedbackAcuerdoPrivacidad
logo
© 2022 Selected Technologies LLC – Morgan Hill, California