29
/es/
es
AIzaSyAYiBZKx7MnpbEhh9jyipgxe19OcubqV5w
April 1, 2024
117678
Czech Republic
CZE
true
2
1
Changes in inventories (current LCU)
2016,2015,2014,2013,2012,2011,2010,2009,2008,2007,2006,2005,2004,2003,2002,2001,2000,1999,1998,1997,1996,1995,1994
Download
Estadísticas Globales de la Biblioteca →Czech Republic →

Changes in inventories (current LCU)

Estas estadísticas en otros países:
AlbaniaAlgeriaAngolaAntigua and BarbudaArgentinaArmeniaArubaAustraliaAustriaAzerbaijanBahamas, TheBahrainBarbadosBelarusBelgiumBelizeBeninBermudaBhutanBoliviaBosnia and HerzegovinaBotswanaBrazilBrunei DarussalamBulgariaBurkina FasoBurundiCabo VerdeCambodiaCameroonCanadaCentral African RepublicChadChileChinaColombiaComorosCongo, Dem. Rep.Congo, Rep.Costa RicaCote d'IvoireCroatiaCubaCyprusCzech RepublicDenmarkDjiboutiDominicaDominican RepublicEcuadorEgypt, Arab Rep.El SalvadorEquatorial GuineaEritreaEstoniaEthiopiaFijiFinlandFranceGabonGambia, TheGeorgiaGermanyGhanaGreeceGrenadaGuatemalaGuineaGuinea-BissauGuyanaHondurasHong Kong SAR, ChinaHungaryIcelandIndiaIndonesiaIran, Islamic Rep.IraqIrelandIsraelItalyJamaicaJapanJordanKazakhstanKenyaKiribatiKorea, Rep.KosovoKuwaitKyrgyz RepublicLao PDRLatviaLebanonLesothoLiberiaLibyaLithuaniaLuxembourgMacao SAR, ChinaMacedonia, FYRMadagascarMalawiMalaysiaMaldivesMaliMaltaMauritaniaMauritiusMexicoMicronesia, Fed. Sts.MoldovaMongoliaMontenegroMoroccoMozambiqueNamibiaNepalNetherlandsNew CaledoniaNew ZealandNicaraguaNigerNigeriaNorwayOmanPakistanPanamaPapua New GuineaParaguayPeruPhilippinesPolandPortugalPuerto RicoQatarRomaniaRussian FederationRwandaSaudi ArabiaSenegalSerbiaSeychellesSierra LeoneSingaporeSlovak RepublicSloveniaSolomon IslandsSomaliaSouth AfricaSouth SudanSpainSri LankaSt. Kitts and NevisSt. LuciaSt. Vincent and the GrenadinesSudanSurinameSwazilandSwedenSwitzerlandSyrian Arab RepublicTajikistanTanzaniaThailandTimor-LesteTogoTongaTrinidad and TobagoTunisiaTurkeyTurkmenistanUgandaUkraineUnited Arab EmiratesUnited KingdomUnited StatesUruguayVanuatuVenezuela, RBVietnamWest Bank and GazaYemen, Rep.ZambiaZimbabwe
línea de tiempo (timeline):
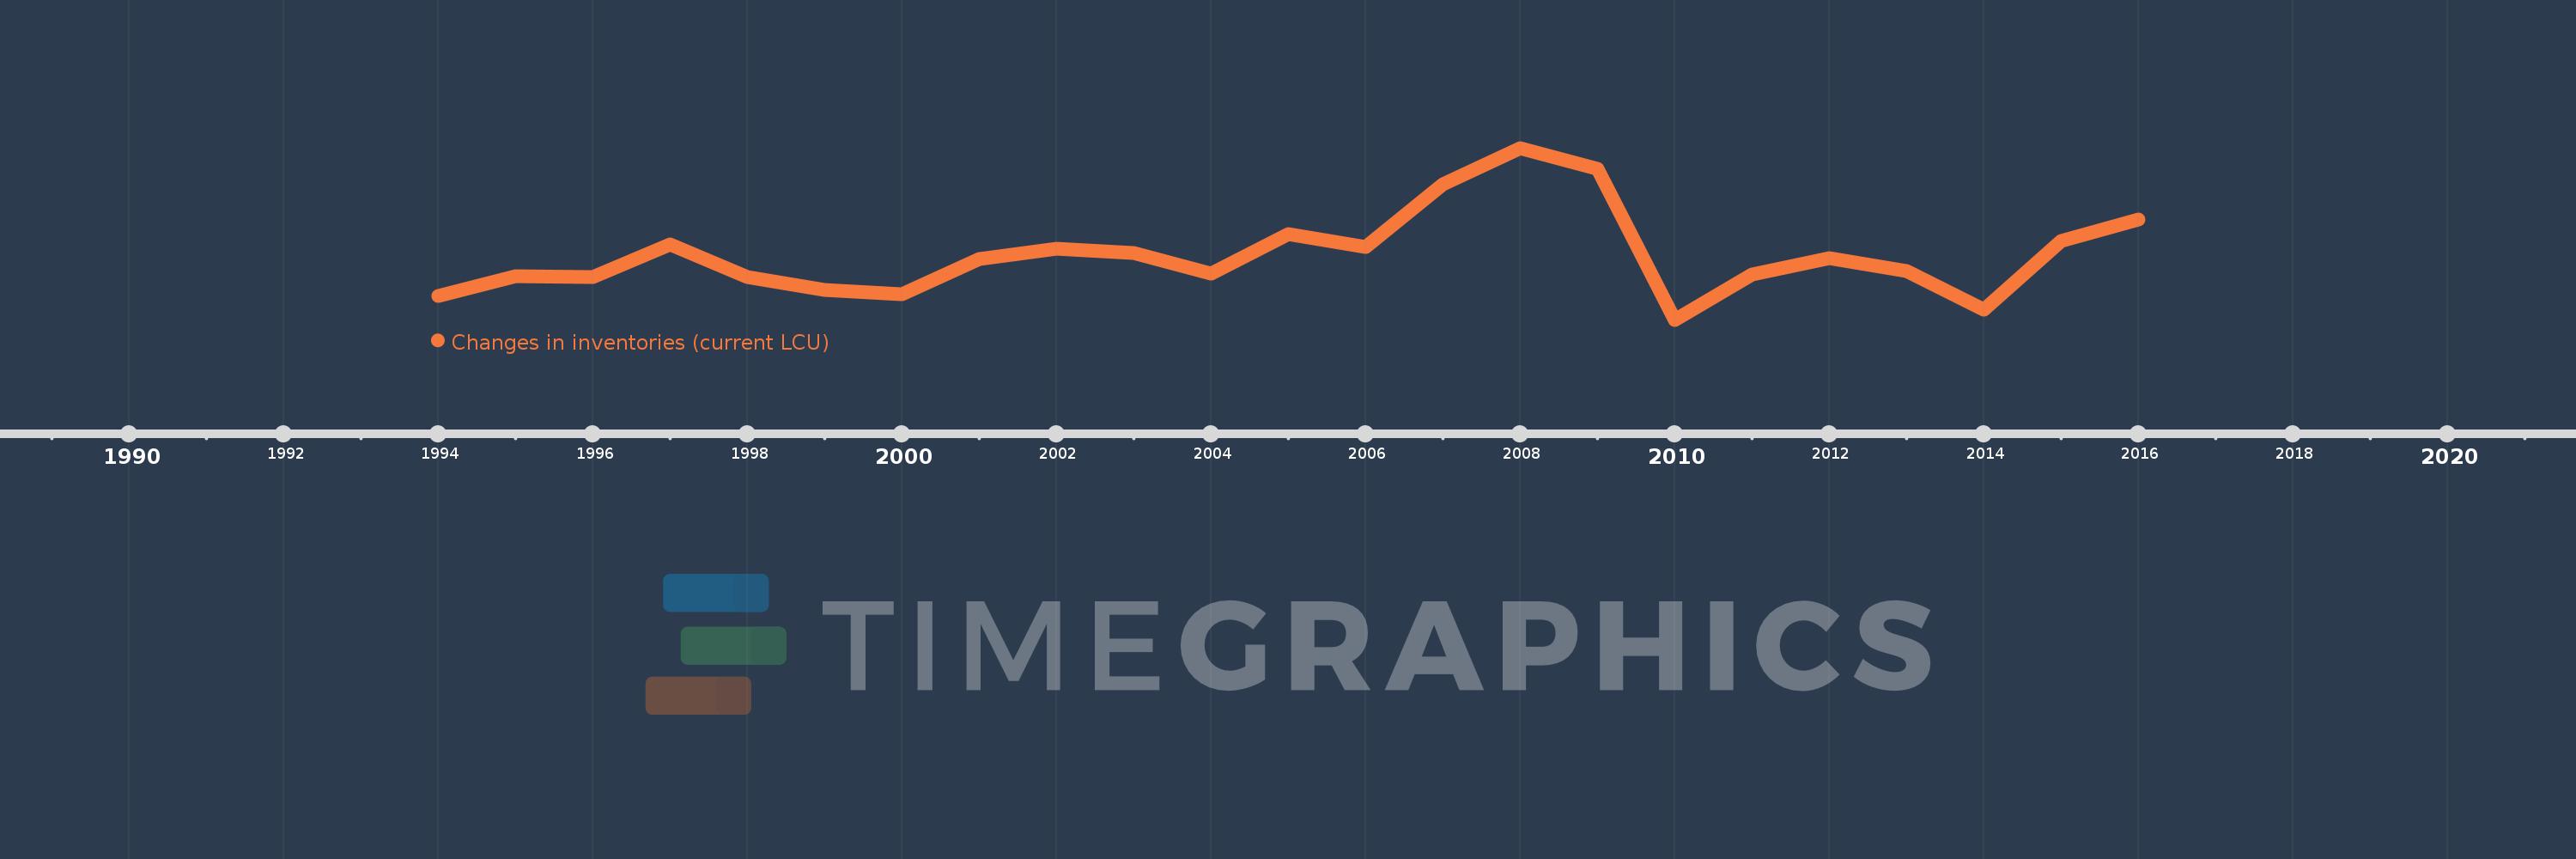
En esta escala de tiempo se presenta un gráfico de 1994 y 2016 de Czech Republic. Los datos de 1993 están ausentes. El número de observaciones reales por fecha: 23.
Fuente (nombre):
Indicadores del desarrollo mundial
Fuente (organización):
World Bank national accounts data, and OECD National Accounts data files.
Categorías:
Economy & Growth
Se ha actualizado:
23 abr 2017 año
Los indicadores de los cambios de valor en los últimos años
En promedio:
22.533 bn
Mínimo:
-23.593 bn
1 ene 2010 año
Máximo:
98.734 bn
1 ene 2008 año
A la fecha de observación
Valor
Cambio absoluto
El cambio con respecto al valor anterior
1 ene 1994 año
-6.421 bn
-6.421 bn
0.0%
1 ene 1995 año
7.35 bn
+13.771 bn
-214.46%
1 ene 1996 año
6.548 bn
-801.783 millones
-10.91%
1 ene 1997 año
30.212 bn
+23.664 bn
361.39%
1 ene 1998 año
6.527 bn
-23.685 bn
-78.4%
1 ene 1999 año
-2.461 bn
-8.988 bn
-137.7%
1 ene 2000 año
-5.271 bn
-2.81 bn
114.18%
1 ene 2001 año
19.449 bn
+24.72 bn
-468.98%
1 ene 2002 año
26.969 bn
+7.52 bn
38.67%
1 ene 2003 año
23.909 bn
-3.06 bn
-11.35%
1 ene 2004 año
9.362 bn
-14.547 bn
-60.84%
1 ene 2005 año
37.647 bn
+28.285 bn
302.13%
1 ene 2006 año
28.49 bn
-9.157 bn
-24.32%
1 ene 2007 año
72.75 bn
+44.26 bn
155.35%
1 ene 2008 año
98.734 bn
+25.984 bn
35.72%
1 ene 2009 año
84.064 bn
-14.67 bn
-14.86%
1 ene 2010 año
-23.593 bn
-107.657 bn
-128.07%
1 ene 2011 año
8.372 bn
+31.965 bn
-135.49%
1 ene 2012 año
20.384 bn
+12.012 bn
143.48%
1 ene 2013 año
11.171 bn
-9.213 bn
-45.2%
1 ene 2014 año
-16.202 bn
-27.373 bn
-245.04%
1 ene 2015 año
32.35 bn
+48.552 bn
-299.67%
1 ene 2016 año
47.926 bn
+15.576 bn
48.15%
Ranking de los países por los datos estadísticos actuales

Comentarios:

Enviar
PremiumAbout & FeedbackAcuerdoPrivacidad
logo
© 2022 Selected Technologies LLC – Morgan Hill, California