33
/es/
AIzaSyB4mHJ5NPEv-XzF7P6NDYXjlkCWaeKw5bc
November 30, 2025
212321
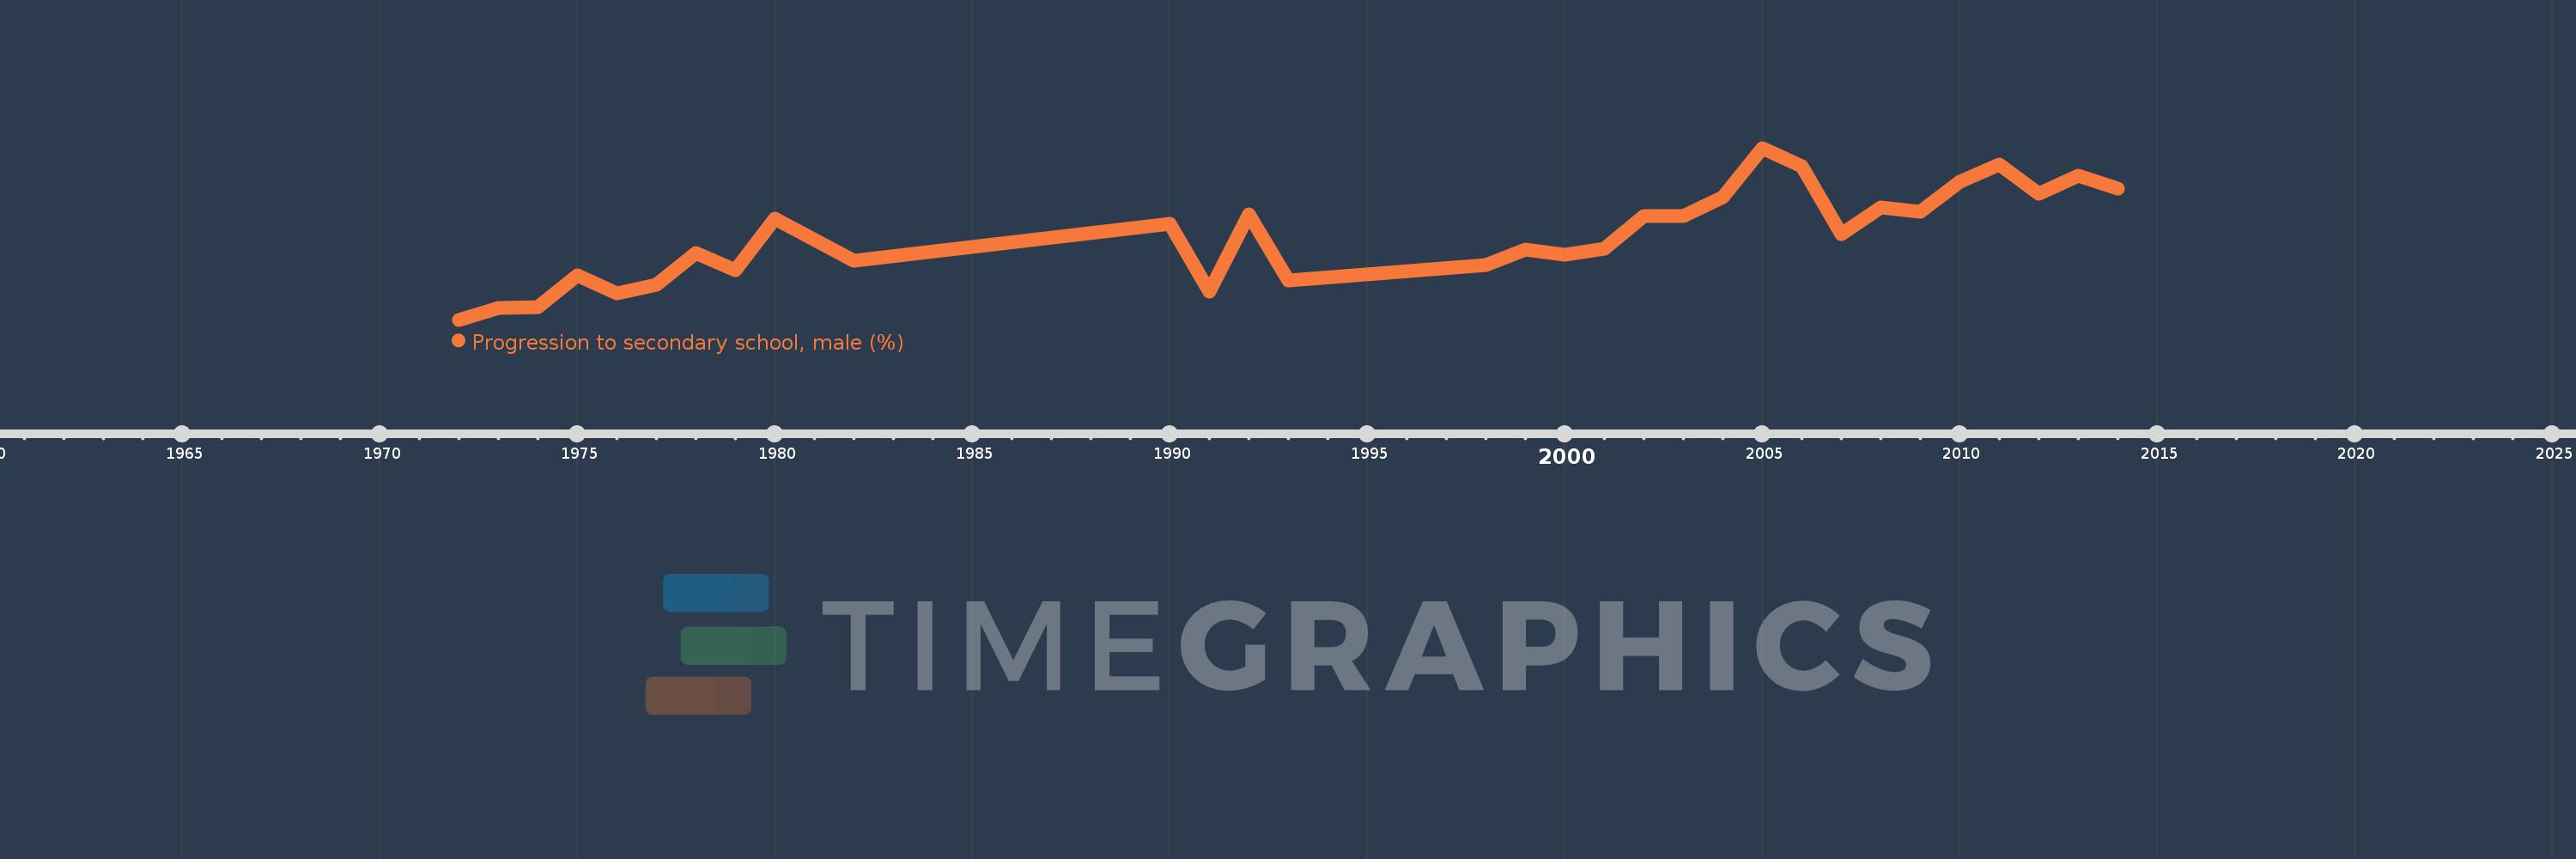
Niger
NER
true
2
1
Progression to secondary school, male (%)
2014,2013,2012,2011,2010,2009,2008,2007,2006,2005,2004,2003,2002,2001,2000,1999,1998,1993,1992,1991,1990,1982,1980,1979,1978,1977,1976,1975,1974,1973,1972