29
/es/
es
AIzaSyAYiBZKx7MnpbEhh9jyipgxe19OcubqV5w
April 1, 2024
195172
Mexico
MEX
true
2
1
All education staff compensation, primary (% of total expenditure in primary public institutions)
2012,2011,2010,2009,2008,2007,2006,2005,2004,2003,2002
Download
Estadísticas Globales de la Biblioteca →Mexico →

All education staff compensation, primary (% of total expenditure in primary public institutions)

Estas estadísticas en otros países:
AlgeriaAndorraAngolaAntigua and BarbudaArgentinaArmeniaArubaAustraliaAustriaBahrainBangladeshBarbadosBelarusBelgiumBelizeBeninBhutanBoliviaBotswanaBrazilBritish Virgin IslandsBulgariaBurkina FasoBurundiCabo VerdeCambodiaCameroonCanadaCaribbean small statesCayman IslandsCentral African RepublicCentral Europe and the BalticsChadChileChinaColombiaComorosCongo, Dem. Rep.Congo, Rep.Costa RicaCote d'IvoireCubaCuracaoCyprusCzech RepublicDenmarkDjiboutiDominicaDominican RepublicEast Asia & Pacific (IDA & IBRD countries)EcuadorEl SalvadorEritreaEstoniaEthiopiaEuro areaEurope & Central AsiaEuropean UnionFinlandFranceGambia, TheGermanyGhanaGuatemalaGuineaGuinea-BissauGuyanaHeavily indebted poor countries (HIPC)High incomeHondurasHungaryIcelandIDA blendIndiaIndonesiaIrelandIsraelItalyJamaicaJapanJordanKazakhstanKorea, Rep.KuwaitLate-demographic dividendLatin America & Caribbean Latin America & Caribbean (excluding high income)Latin America & the Caribbean (IDA & IBRD countries)LatviaLebanonLesothoLiechtensteinLithuaniaLow incomeLuxembourgMacao SAR, ChinaMadagascarMalawiMalaysiaMaliMaltaMarshall IslandsMauritaniaMauritiusMexicoMoldovaMonacoMongoliaMoroccoMozambiqueNamibiaNetherlandsNicaraguaNigerNorth AmericaNorwayOECD membersOmanPanamaParaguayPeruPhilippinesPolandPortugalPost-demographic dividendPuerto RicoRomaniaRwandaSan MarinoSao Tome and PrincipeSerbiaSeychellesSierra LeoneSlovak RepublicSloveniaSouth AfricaSpainSri LankaSt. Kitts and NevisSt. LuciaSt. Vincent and the GrenadinesSub-Saharan Africa Sub-Saharan Africa (excluding high income)Sub-Saharan Africa (IDA & IBRD countries)SwedenSwitzerlandSyrian Arab RepublicThailandTimor-LesteTogoTunisiaTurkeyTurks and Caicos IslandsUgandaUnited Arab EmiratesUnited KingdomUnited StatesUruguayVanuatuVenezuela, RBVietnamYemen, Rep.Zambia
línea de tiempo (timeline):
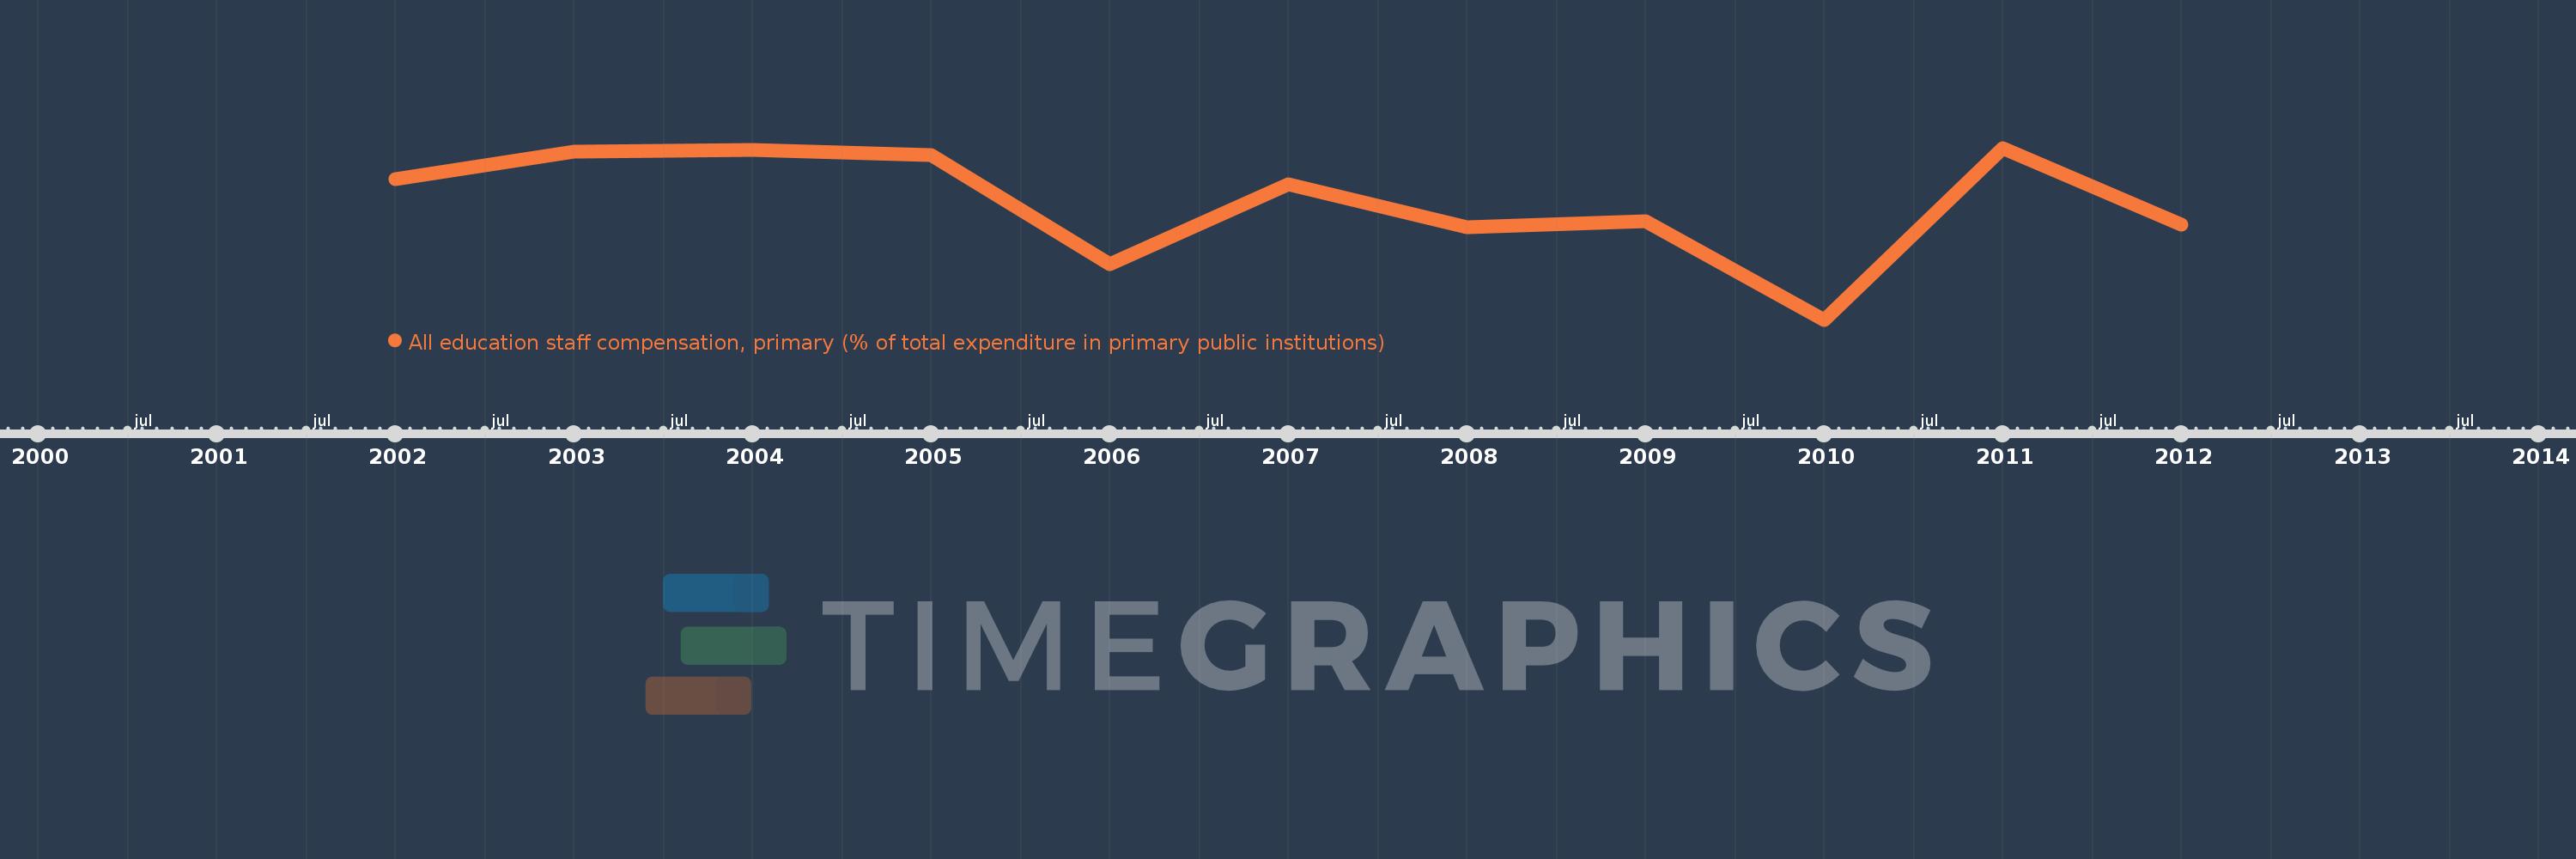
En esta escala de tiempo se presenta un gráfico de 2002 y 2012 de Mexico. Los datos de 2001 están ausentes. El número de observaciones reales por fecha: 11.
Fuente (nombre):
Indicadores del desarrollo mundial
Fuente (organización):
United Nations Educational, Scientific, and Cultural Organization (UNESCO) Institute for Statistics.
Categorías:
Education
Se ha actualizado:
23 abr 2017 año
Los indicadores de los cambios de valor en los últimos años
En promedio:
92.628
Mínimo:
90.244
1 ene 2010 año
Máximo:
93.731
1 ene 2011 año
A la fecha de observación
Valor
Cambio absoluto
El cambio con respecto al valor anterior
1 ene 2002 año
93.09
+93.09
0.0%
1 ene 2003 año
93.662
+0.571
0.61%
1 ene 2004 año
93.685
+0.023
0.02%
1 ene 2005 año
93.595
-0.09
-0.1%
1 ene 2006 año
91.37
-2.225
-2.38%
1 ene 2007 año
92.985
+1.615
1.77%
1 ene 2008 año
92.121
-0.865
-0.93%
1 ene 2009 año
92.24
+0.12
0.13%
1 ene 2010 año
90.244
-1.997
-2.16%
1 ene 2011 año
93.731
+3.487
3.86%
1 ene 2012 año
92.18
-1.551
-1.65%
Ranking de los países por los datos estadísticos actuales

Comentarios:

Enviar
PremiumAbout & FeedbackAcuerdoPrivacidad
logo
© 2022 Selected Technologies LLC – Morgan Hill, California