33
/es/
AIzaSyAYiBZKx7MnpbEhh9jyipgxe19OcubqV5w
August 1, 2025
177181
Lebanon
LBN
true
2
1
Total debt service (% of GNI)
2016,2015,2014,2013,2012,2011,2010,2009,2008,2007,2006,2005,2004,2003,2002,2001,2000,1999,1998,1997,1996,1995,1994,1993,1992,1991,1990
Download
Estadísticas Globales de la Biblioteca →Lebanon →

Total debt service (% of GNI)

Estas estadísticas en otros países:

AfghanistanAlbaniaAlgeriaAngolaArab WorldArgentinaArmeniaAzerbaijanBangladeshBelarusBelizeBeninBhutanBoliviaBosnia and HerzegovinaBotswanaBrazilBulgariaBurkina FasoBurundiCabo VerdeCambodiaCameroonCentral African RepublicCentral Europe and the BalticsChadChinaColombiaComorosCongo, Dem. Rep.Congo, Rep.Costa RicaCote d'IvoireDjiboutiDominicaDominican RepublicEarly-demographic dividendEast Asia & Pacific (excluding high income)East Asia & Pacific (IDA & IBRD countries)EcuadorEgypt, Arab Rep.El SalvadorEritreaEthiopiaEurope & Central Asia (excluding high income)Europe & Central Asia (IDA & IBRD countries)FijiFragile and conflict affected situationsGabonGambia, TheGeorgiaGhanaGrenadaGuatemalaGuineaGuinea-BissauGuyanaHaitiHeavily indebted poor countries (HIPC)HondurasIBRD onlyIDA & IBRD totalIDA blendIDA onlyIDA totalIndiaIndonesiaIran, Islamic Rep.JamaicaJordanKazakhstanKenyaKosovoKyrgyz RepublicLao PDRLate-demographic dividendLatin America & Caribbean Latin America & Caribbean (excluding high income)Latin America & the Caribbean (IDA & IBRD countries)Least developed countries: UN classificationLebanonLesothoLiberiaLow & middle incomeLow incomeLower middle incomeMacedonia, FYRMadagascarMalawiMalaysiaMaldivesMaliMauritaniaMauritiusMexicoMiddle East & North Africa (excluding high income)Middle East & North Africa (IDA & IBRD countries)Middle incomeMoldovaMongoliaMontenegroMoroccoMozambiqueMyanmarNepalNicaraguaNigerNigeriaPacific island small statesPakistanPanamaPapua New GuineaParaguayPeruPhilippinesPre-demographic dividendRomaniaRussian FederationRwandaSamoaSao Tome and PrincipeSenegalSerbiaSierra LeoneSolomon IslandsSomaliaSouth AfricaSouth AsiaSouth Asia (IDA & IBRD)Sri LankaSt. LuciaSt. Vincent and the GrenadinesSub-Saharan Africa Sub-Saharan Africa (excluding high income)Sub-Saharan Africa (IDA & IBRD countries)SudanSwazilandSyrian Arab RepublicTajikistanTanzaniaThailandTogoTongaTunisiaTurkeyTurkmenistanUgandaUkraineUpper middle incomeUzbekistanVanuatuVenezuela, RBVietnamYemen, Rep.ZambiaZimbabwe

línea de tiempo (timeline):

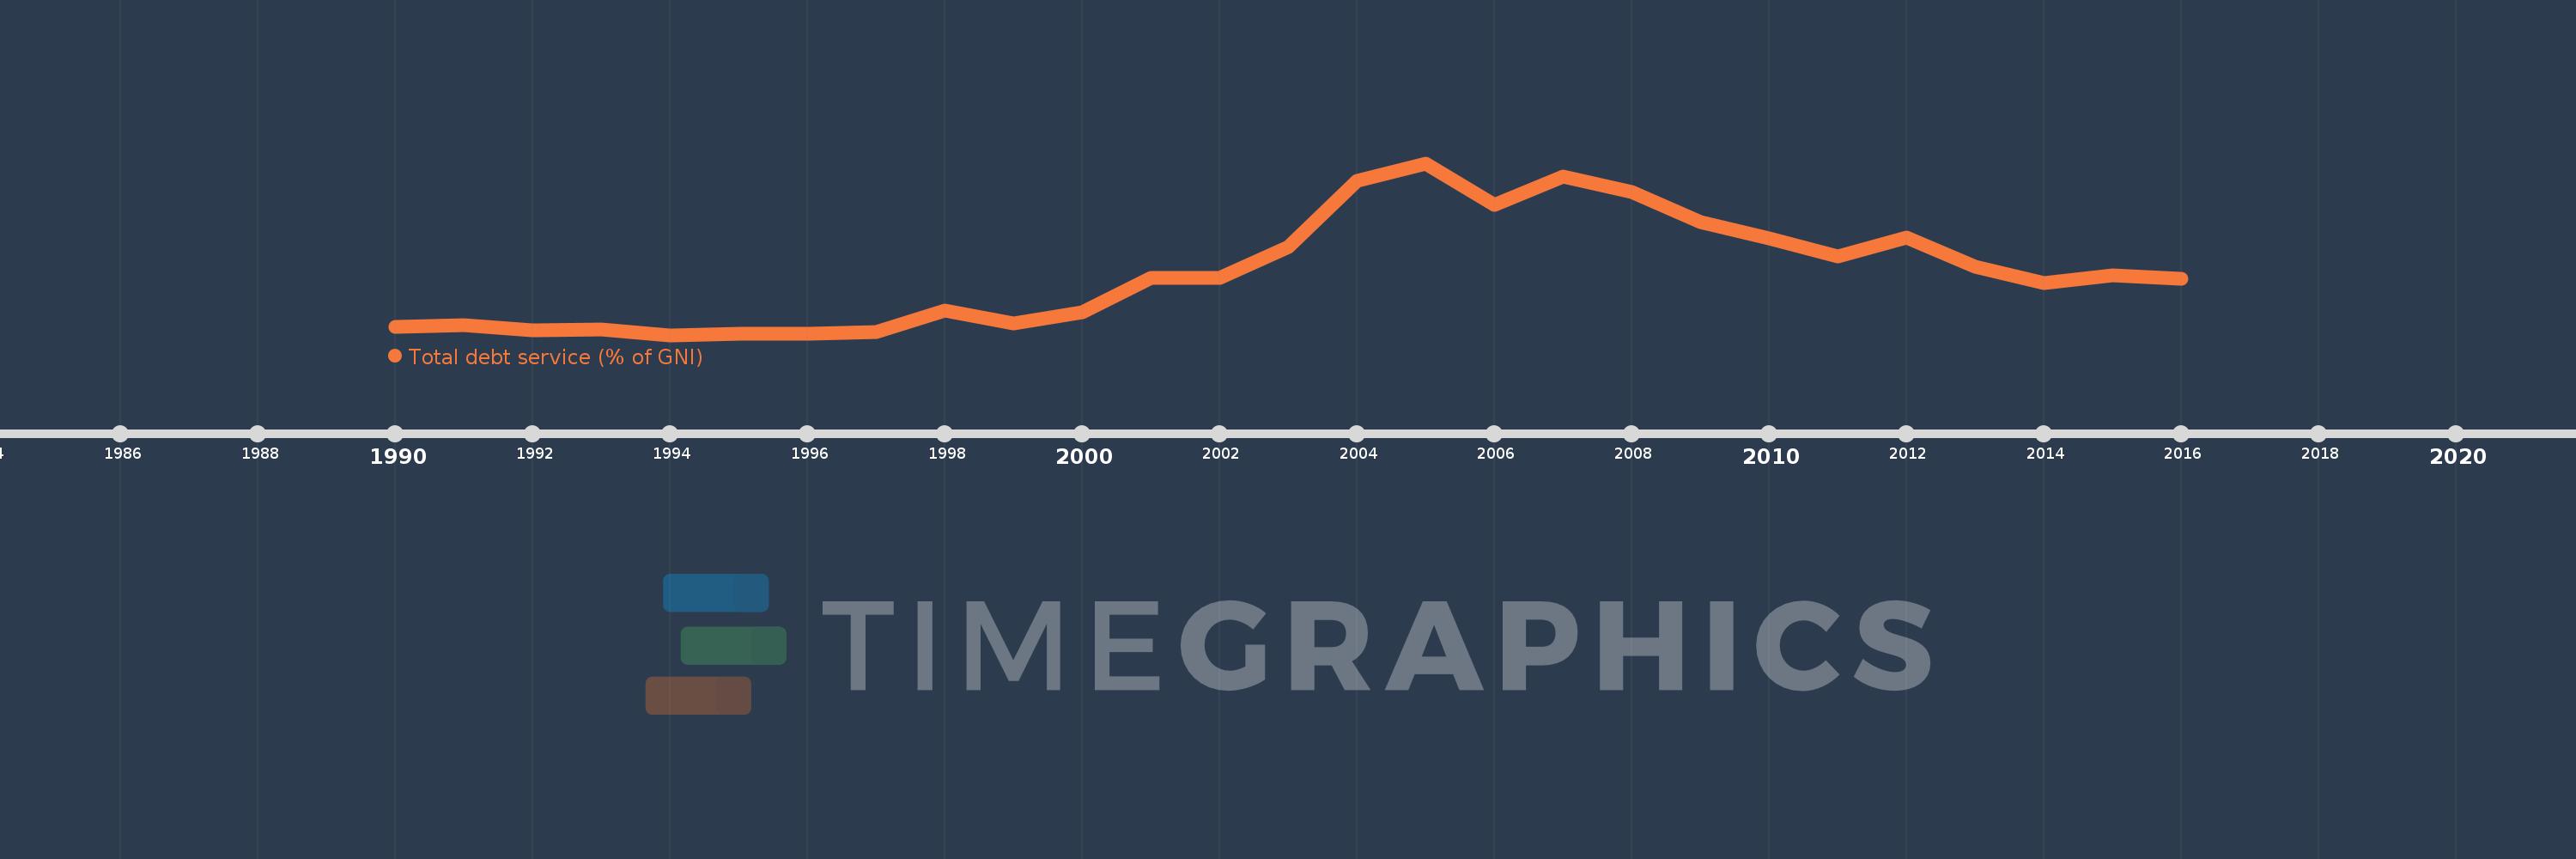
En esta escala de tiempo se presenta un gráfico de 1990 y 2016 de Lebanon. Los datos de 1989 están ausentes. El número de observaciones reales por fecha: 27.

Fuente (nombre):

Indicadores del desarrollo mundial

Fuente (organización):

World Bank, International Debt Statistics.

Categorías:

Economy & Growth, External Debt

Se ha actualizado:

23 abr 2017 año

Los indicadores de los cambios de valor en los últimos años

En promedio:
9.098
Mínimo:
1.743
1 ene 1994 año
Máximo:
22.14
1 ene 2005 año
A la fecha de observación
Valor
Cambio absoluto
El cambio con respecto al valor anterior
1 ene 1990 año
2.694
+2.694
0.0%
1 ene 1991 año
2.872
+0.178
6.61%
1 ene 1992 año
2.343
-0.529
-18.41%
1 ene 1993 año
2.387
+0.044
1.87%
1 ene 1994 año
1.743
-0.644
-26.99%
1 ene 1995 año
1.864
+0.121
6.96%
1 ene 1996 año
1.846
-0.018
-0.99%
1 ene 1997 año
2.145
+0.3
16.23%
1 ene 1998 año
4.606
+2.46
114.69%
1 ene 1999 año
3.096
-1.51
-32.78%
1 ene 2000 año
4.446
+1.35
43.62%
1 ene 2001 año
8.481
+4.035
90.74%
1 ene 2002 año
8.483
+0.002
0.02%
1 ene 2003 año
12.158
+3.675
43.32%
1 ene 2004 año
20.061
+7.904
65.01%
1 ene 2005 año
22.14
+2.079
10.36%
1 ene 2006 año
17.222
-4.918
-22.21%
1 ene 2007 año
20.567
+3.345
19.42%
1 ene 2008 año
18.746
-1.822
-8.86%
1 ene 2009 año
15.125
-3.621
-19.31%
1 ene 2010 año
13.209
-1.916
-12.67%
1 ene 2011 año
11.073
-2.136
-16.17%
1 ene 2012 año
13.349
+2.276
20.56%
1 ene 2013 año
9.808
-3.541
-26.53%
1 ene 2014 año
7.953
-1.855
-18.92%
1 ene 2015 año
8.808
+0.855
10.75%
1 ene 2016 año
8.422
-0.385
-4.38%

Ranking de los países por los datos estadísticos actuales