29
/es/
es
AIzaSyAYiBZKx7MnpbEhh9jyipgxe19OcubqV5w
April 1, 2024
138850
Georgia
GEO
true
2
1
Total debt service (% of GNI)
2016,2015,2014,2013,2012,2011,2010,2009,2008,2007,2006,2005,2004,2003,2002,2001,2000,1999,1998,1997,1996,1995,1994
Download
Estadísticas Globales de la Biblioteca →Georgia →

Total debt service (% of GNI)

Estas estadísticas en otros países:
AfghanistanAlbaniaAlgeriaAngolaArab WorldArgentinaArmeniaAzerbaijanBangladeshBelarusBelizeBeninBhutanBoliviaBosnia and HerzegovinaBotswanaBrazilBulgariaBurkina FasoBurundiCabo VerdeCambodiaCameroonCentral African RepublicCentral Europe and the BalticsChadChinaColombiaComorosCongo, Dem. Rep.Congo, Rep.Costa RicaCote d'IvoireDjiboutiDominicaDominican RepublicEarly-demographic dividendEast Asia & Pacific (excluding high income)East Asia & Pacific (IDA & IBRD countries)EcuadorEgypt, Arab Rep.El SalvadorEritreaEthiopiaEurope & Central Asia (excluding high income)Europe & Central Asia (IDA & IBRD countries)FijiFragile and conflict affected situationsGabonGambia, TheGeorgiaGhanaGrenadaGuatemalaGuineaGuinea-BissauGuyanaHaitiHeavily indebted poor countries (HIPC)HondurasIBRD onlyIDA & IBRD totalIDA blendIDA onlyIDA totalIndiaIndonesiaIran, Islamic Rep.JamaicaJordanKazakhstanKenyaKosovoKyrgyz RepublicLao PDRLate-demographic dividendLatin America & Caribbean Latin America & Caribbean (excluding high income)Latin America & the Caribbean (IDA & IBRD countries)Least developed countries: UN classificationLebanonLesothoLiberiaLow & middle incomeLow incomeLower middle incomeMacedonia, FYRMadagascarMalawiMalaysiaMaldivesMaliMauritaniaMauritiusMexicoMiddle East & North Africa (excluding high income)Middle East & North Africa (IDA & IBRD countries)Middle incomeMoldovaMongoliaMontenegroMoroccoMozambiqueMyanmarNepalNicaraguaNigerNigeriaPacific island small statesPakistanPanamaPapua New GuineaParaguayPeruPhilippinesPre-demographic dividendRomaniaRussian FederationRwandaSamoaSao Tome and PrincipeSenegalSerbiaSierra LeoneSolomon IslandsSomaliaSouth AfricaSouth AsiaSouth Asia (IDA & IBRD)Sri LankaSt. LuciaSt. Vincent and the GrenadinesSub-Saharan Africa Sub-Saharan Africa (excluding high income)Sub-Saharan Africa (IDA & IBRD countries)SudanSwazilandSyrian Arab RepublicTajikistanTanzaniaThailandTogoTongaTunisiaTurkeyTurkmenistanUgandaUkraineUpper middle incomeUzbekistanVanuatuVenezuela, RBVietnamYemen, Rep.ZambiaZimbabwe
línea de tiempo (timeline):
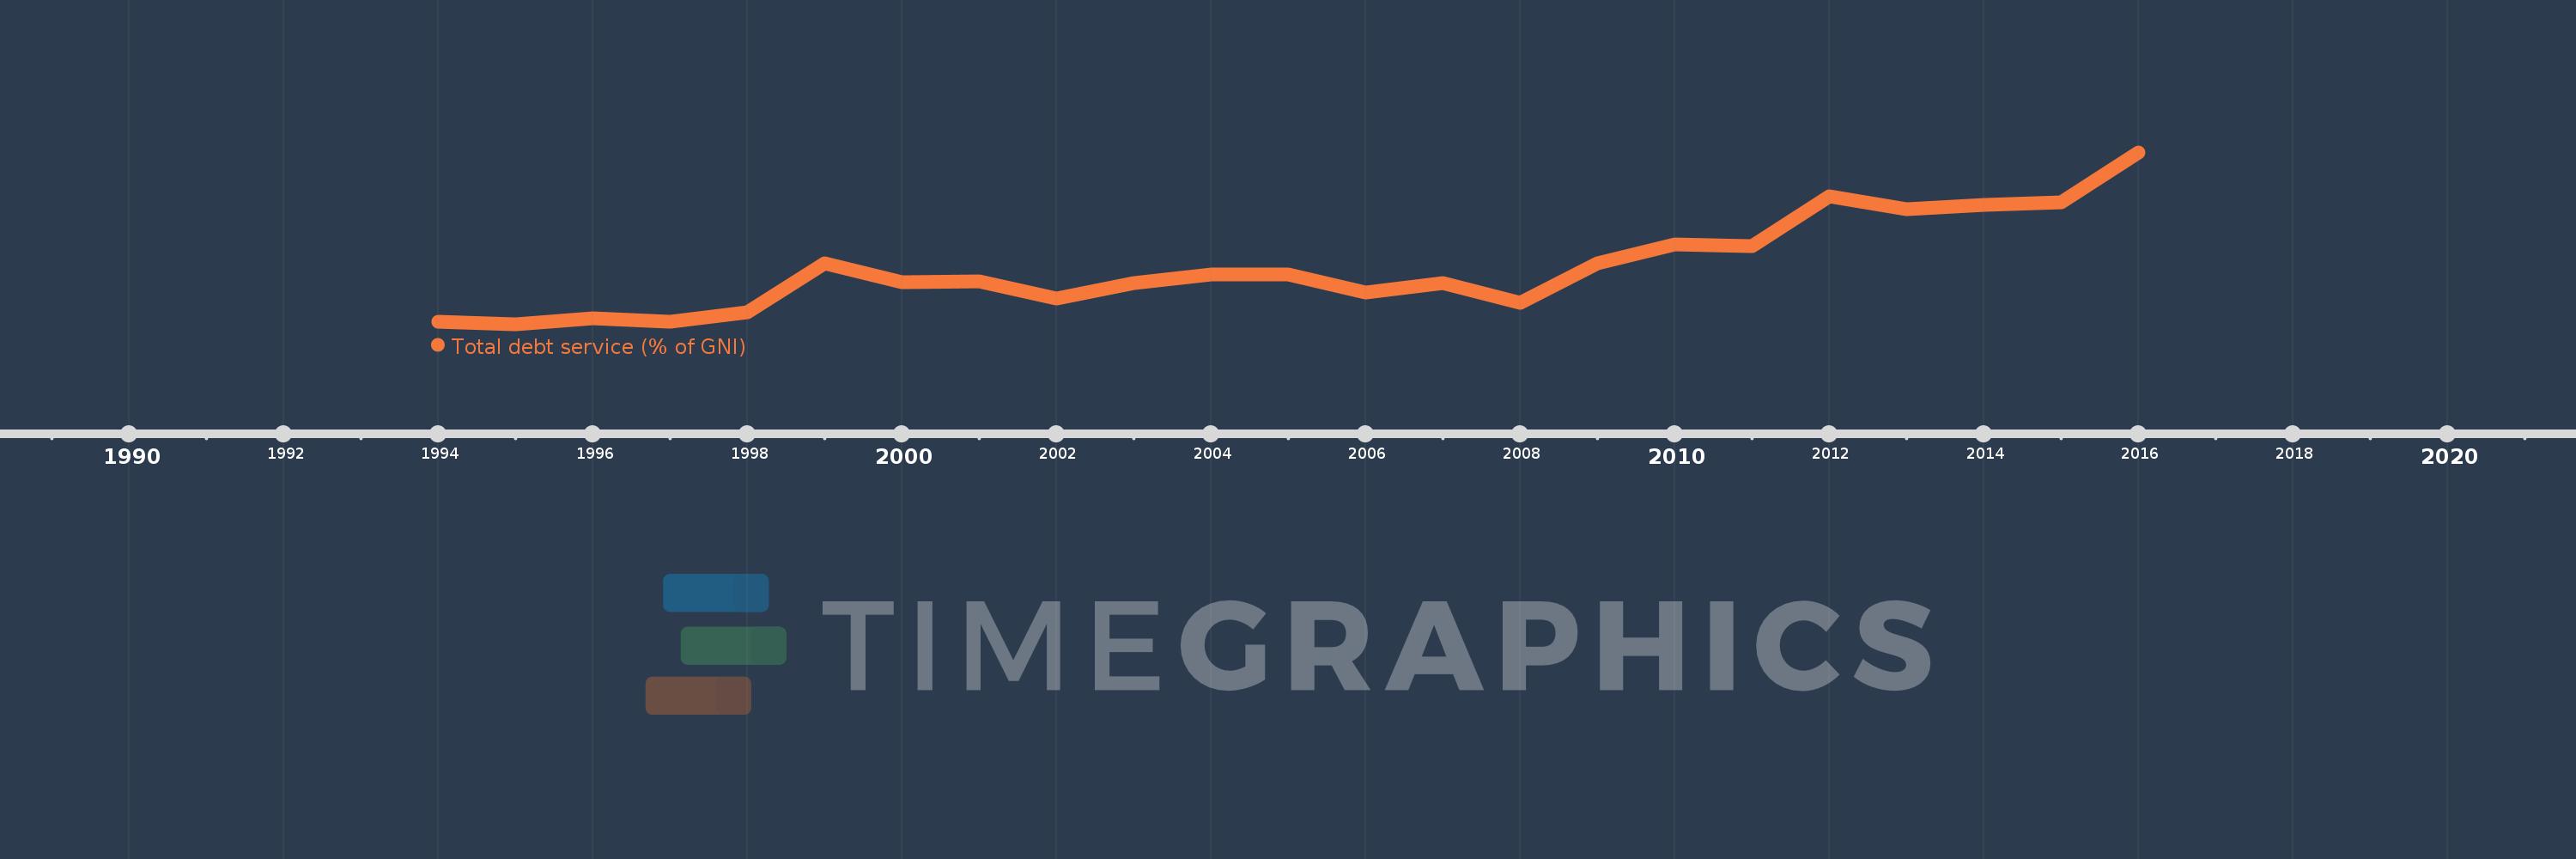
En esta escala de tiempo se presenta un gráfico de 1994 y 2016 de Georgia. Los datos de 1993 están ausentes. El número de observaciones reales por fecha: 23.
Fuente (nombre):
Indicadores del desarrollo mundial
Fuente (organización):
World Bank, International Debt Statistics.
Categorías:
Economy & Growth, External Debt
Se ha actualizado:
23 abr 2017 año
Los indicadores de los cambios de valor en los últimos años
En promedio:
5.219
Mínimo:
0.24
1 ene 1995 año
Máximo:
15.328
1 ene 2016 año
A la fecha de observación
Valor
Cambio absoluto
El cambio con respecto al valor anterior
1 ene 1994 año
0.485
+0.485
0.0%
1 ene 1995 año
0.24
-0.245
-50.51%
1 ene 1996 año
0.779
+0.538
224.05%
1 ene 1997 año
0.427
-0.351
-45.13%
1 ene 1998 año
1.276
+0.849
198.66%
1 ene 1999 año
5.586
+4.31
337.84%
1 ene 2000 año
3.942
-1.643
-29.42%
1 ene 2001 año
3.968
+0.025
0.64%
1 ene 2002 año
2.506
-1.461
-36.83%
1 ene 2003 año
3.886
+1.38
55.05%
1 ene 2004 año
4.591
+0.705
18.15%
1 ene 2005 año
4.582
-0.009
-0.2%
1 ene 2006 año
3.009
-1.574
-34.34%
1 ene 2007 año
3.836
+0.828
27.51%
1 ene 2008 año
2.129
-1.708
-44.51%
1 ene 2009 año
5.624
+3.495
164.21%
1 ene 2010 año
7.228
+1.604
28.51%
1 ene 2011 año
7.123
-0.104
-1.44%
1 ene 2012 año
11.459
+4.335
60.86%
1 ene 2013 año
10.332
-1.127
-9.83%
1 ene 2014 año
10.742
+0.41
3.97%
1 ene 2015 año
10.965
+0.223
2.08%
1 ene 2016 año
15.328
+4.363
39.79%
Ranking de los países por los datos estadísticos actuales

Comentarios:

Enviar
PremiumAbout & FeedbackAcuerdoPrivacidad
logo
© 2022 Selected Technologies LLC – Morgan Hill, California