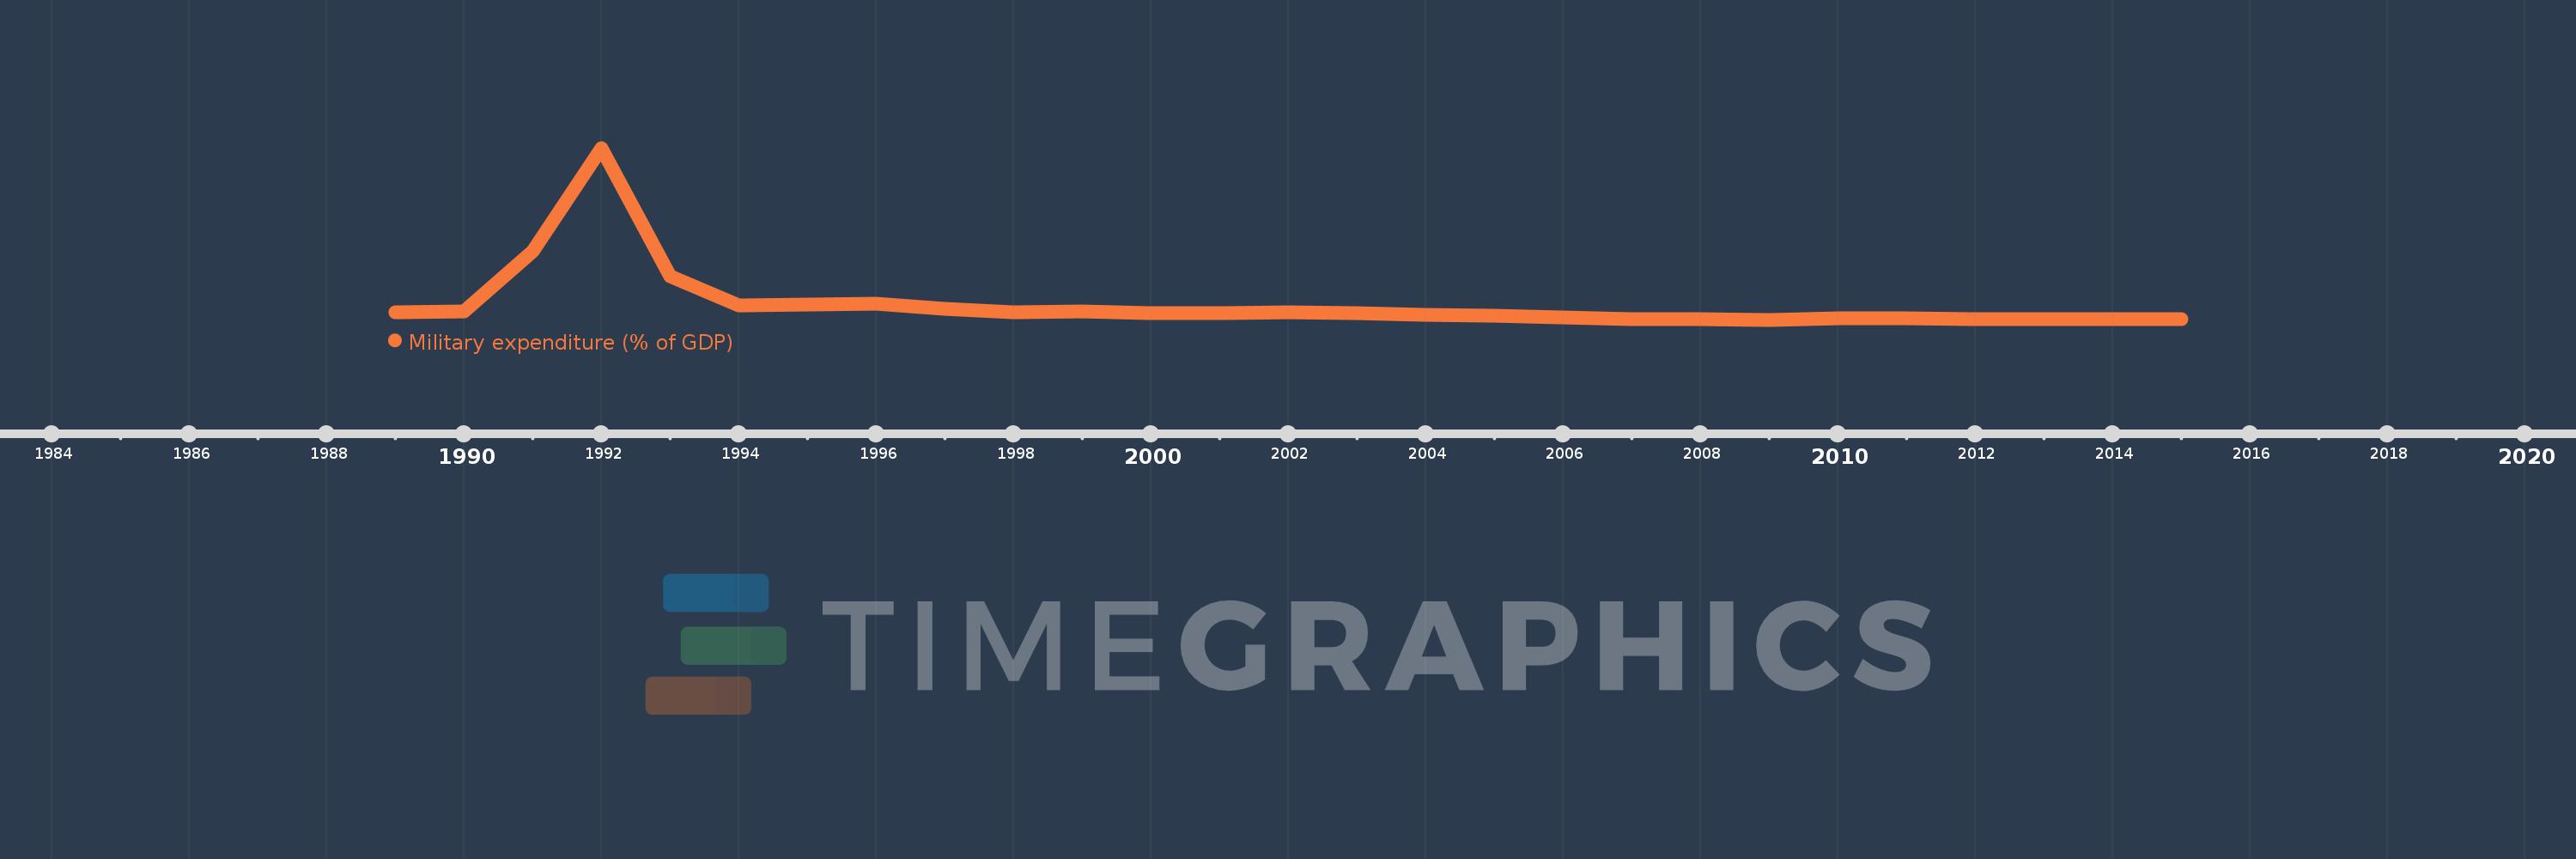
En esta escala de tiempo se presenta un gráfico de 1989 y 2015 de Kuwait. Los datos de 1988 están ausentes. El número de observaciones reales por fecha: 27.
Fuente (nombre):
Indicadores del desarrollo mundial
Fuente (organización):
Stockholm International Peace Research Institute (SIPRI), Yearbook: Armaments, Disarmament and International Security.
Categorías:
Public Sector
Se ha actualizado:
23 abr 2017 año
Los indicadores de los cambios de valor en los últimos años
En promedio:
13.309
Mínimo:
3.006
1 ene 2009 año
Máximo:
117.388
1 ene 1992 año
A la fecha de observación
Valor
Cambio absoluto
El cambio con respecto al valor anterior
1 ene 1989 año
8.236
+8.236
0.0%
1 ene 1990 año
8.54
+0.304
3.69%
1 ene 1991 año
48.707
+40.167
470.35%
1 ene 1992 año
117.388
+68.68
141.01%
1 ene 1993 año
31.786
-85.602
-72.92%
1 ene 1994 año
12.441
-19.345
-60.86%
1 ene 1995 año
13.259
+0.818
6.58%
1 ene 1996 año
13.581
+0.323
2.43%
1 ene 1997 año
10.292
-3.289
-24.22%
1 ene 1998 año
8.087
-2.206
-21.43%
1 ene 1999 año
8.796
+0.709
8.77%
1 ene 2000 año
7.591
-1.205
-13.7%
1 ene 2001 año
7.151
-0.44
-5.8%
1 ene 2002 año
7.697
+0.546
7.64%
1 ene 2003 año
7.399
-0.298
-3.88%
1 ene 2004 año
6.54
-0.859
-11.61%
1 ene 2005 año
5.804
-0.735
-11.24%
1 ene 2006 año
4.343
-1.461
-25.17%
1 ene 2007 año
3.543
-0.801
-18.44%
1 ene 2008 año
3.59
+0.048
1.35%
1 ene 2009 año
3.006
-0.584
-16.27%
1 ene 2010 año
3.974
+0.968
32.21%
1 ene 2011 año
3.756
-0.218
-5.49%
1 ene 2012 año
3.501
-0.255
-6.78%
1 ene 2013 año
3.414
-0.088
-2.5%
1 ene 2014 año
3.272
-0.142
-4.17%
1 ene 2015 año
3.653
+0.382
11.67%
Ranking de los países por los datos estadísticos actuales