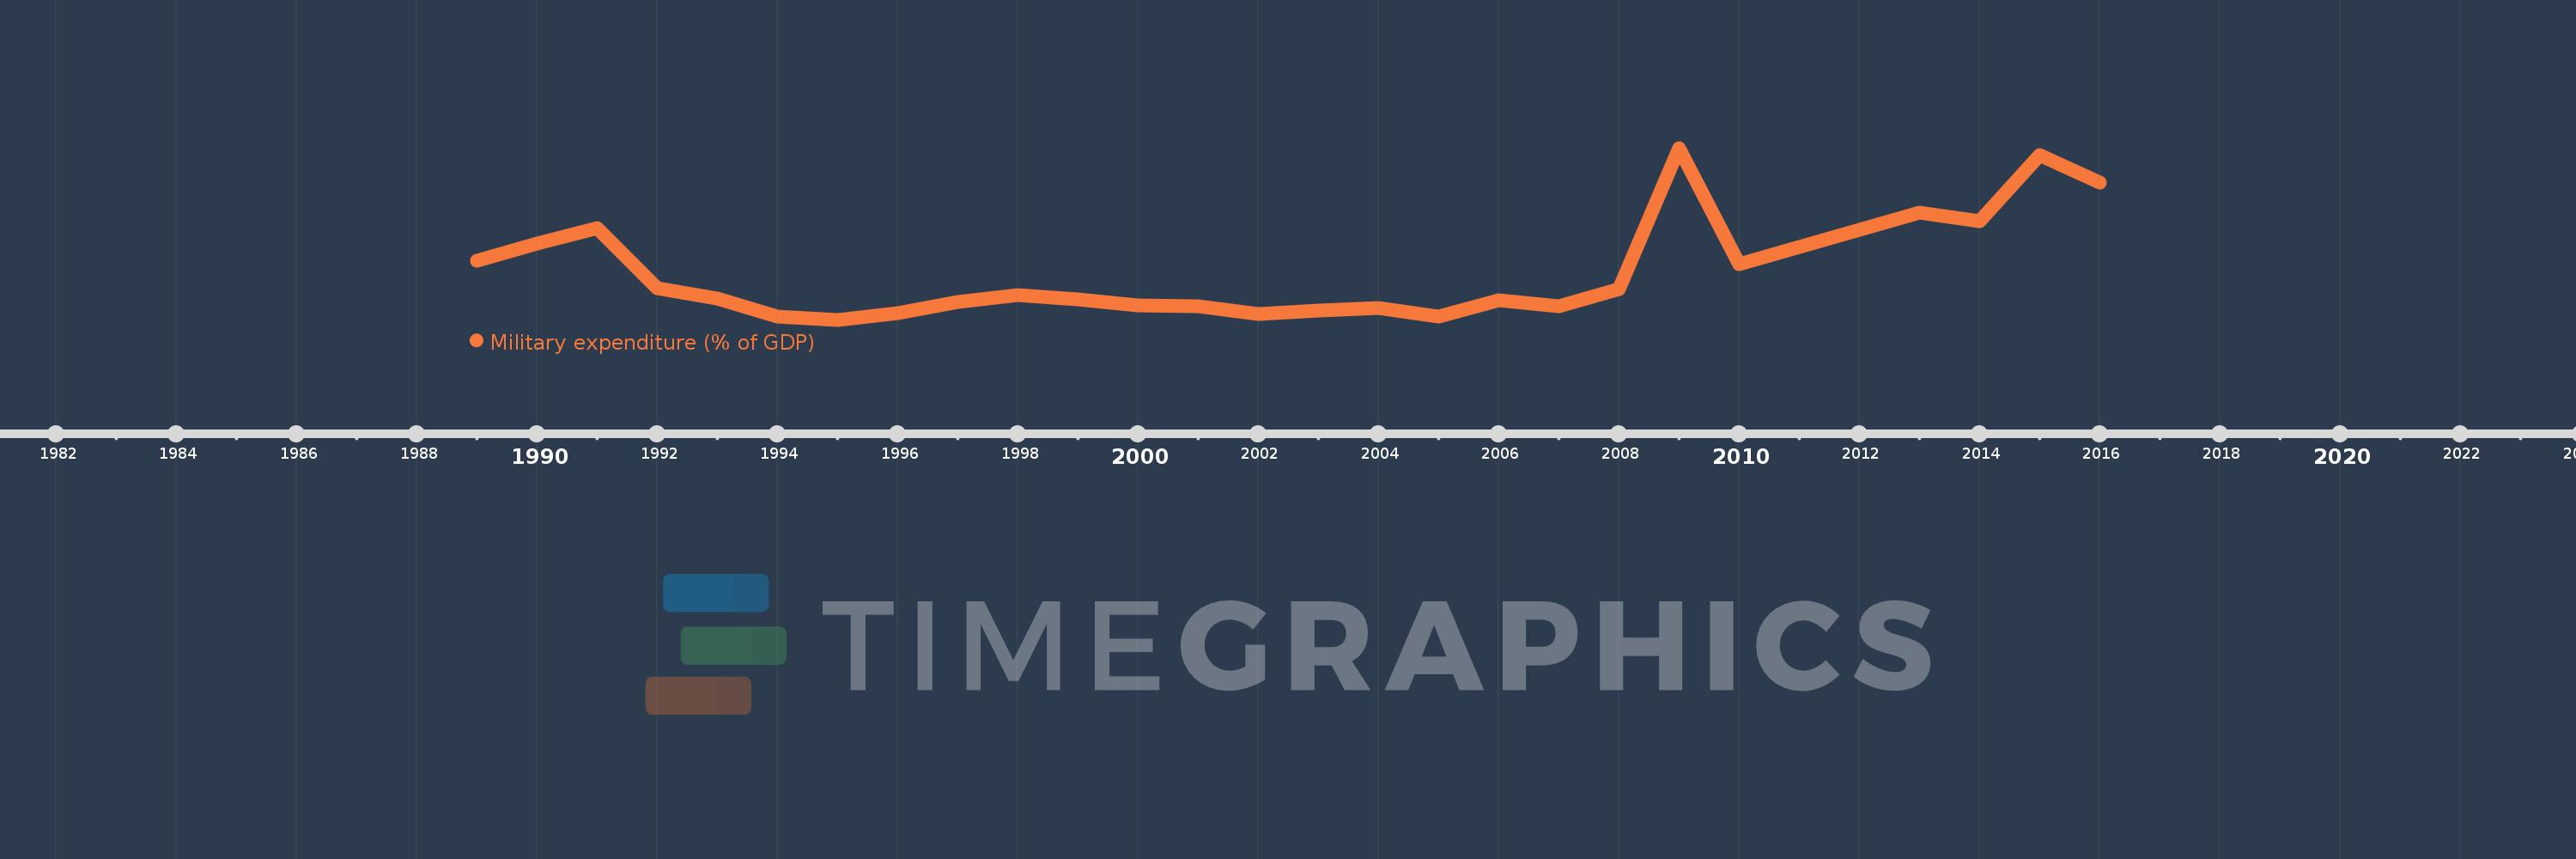
En esta escala de tiempo se presenta un gráfico de 1989 y 2016 de Gambia, The. Los datos de 1988 están ausentes. El número de observaciones reales por fecha: 26.
Fuente (nombre):
Indicadores del desarrollo mundial
Fuente (organización):
Stockholm International Peace Research Institute (SIPRI), Yearbook: Armaments, Disarmament and International Security.
Categorías:
Public Sector
Se ha actualizado:
23 abr 2017 año
Los indicadores de los cambios de valor en los últimos años
En promedio:
0.707
Mínimo:
0.31
1 ene 1995 año
Máximo:
1.777
1 ene 2009 año
A la fecha de observación
Valor
Cambio absoluto
El cambio con respecto al valor anterior
1 ene 1989 año
0.811
+0.811
0.0%
1 ene 1990 año
0.958
+0.148
18.24%
1 ene 1991 año
1.093
+0.134
14.02%
1 ene 1992 año
0.579
-0.514
-47.02%
1 ene 1993 año
0.49
-0.089
-15.31%
1 ene 1994 año
0.339
-0.152
-30.94%
1 ene 1995 año
0.31
-0.028
-8.33%
1 ene 1996 año
0.367
+0.057
18.32%
1 ene 1997 año
0.463
+0.096
26.15%
1 ene 1998 año
0.52
+0.056
12.18%
1 ene 1999 año
0.482
-0.038
-7.27%
1 ene 2000 año
0.432
-0.05
-10.37%
1 ene 2001 año
0.425
-0.007
-1.72%
1 ene 2002 año
0.357
-0.067
-15.9%
1 ene 2003 año
0.391
+0.034
9.44%
1 ene 2004 año
0.41
+0.019
4.99%
1 ene 2005 año
0.334
-0.077
-18.65%
1 ene 2006 año
0.478
+0.145
43.32%
1 ene 2007 año
0.425
-0.053
-11.06%
1 ene 2008 año
0.569
+0.144
33.82%
1 ene 2009 año
1.777
+1.208
212.24%
1 ene 2010 año
0.788
-0.989
-55.67%
1 ene 2013 año
1.224
+0.437
55.41%
1 ene 2014 año
1.148
-0.076
-6.2%
1 ene 2015 año
1.719
+0.571
49.72%
1 ene 2016 año
1.481
-0.238
-13.86%
Ranking de los países por los datos estadísticos actuales