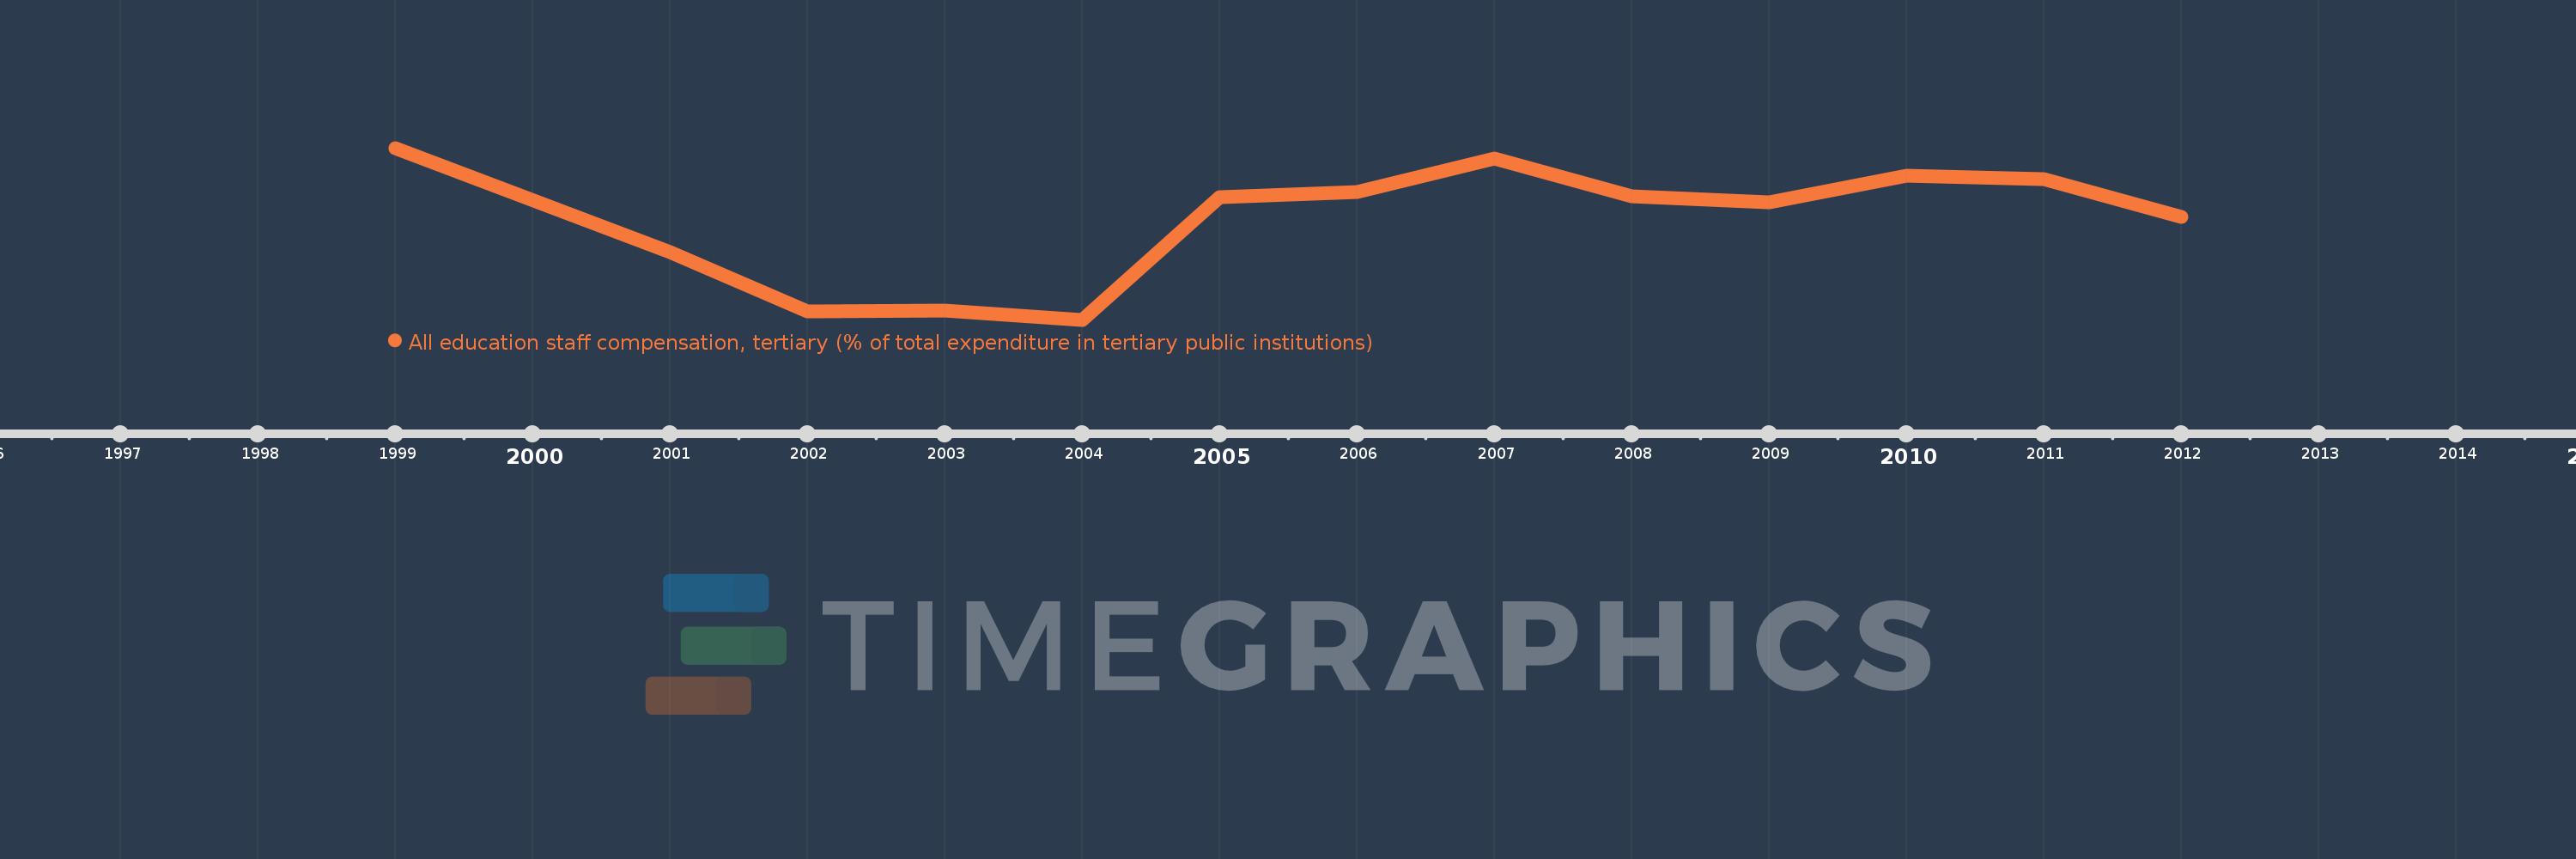
En esta escala de tiempo se presenta un gráfico de 1999 y 2012 de Italy. Los datos de 1998 están ausentes. El número de observaciones reales por fecha: 13.
Fuente (nombre):
Indicadores del desarrollo mundial
Fuente (organización):
United Nations Educational, Scientific, and Cultural Organization (UNESCO) Institute for Statistics.
Categorías:
Education
Se ha actualizado:
23 abr 2017 año
Los indicadores de los cambios de valor en los últimos años
En promedio:
57.973
Mínimo:
52.148
1 ene 2004 año
Máximo:
62.173
1 ene 1999 año
A la fecha de observación
Valor
Cambio absoluto
El cambio con respecto al valor anterior
1 ene 1999 año
62.173
+62.173
0.0%
1 ene 2001 año
56.08
-6.093
-9.8%
1 ene 2002 año
52.659
-3.421
-6.1%
1 ene 2003 año
52.662
+0.002
0.0%
1 ene 2004 año
52.148
-0.513
-0.97%
1 ene 2005 año
59.283
+7.135
13.68%
1 ene 2006 año
59.586
+0.303
0.51%
1 ene 2007 año
61.565
+1.979
3.32%
1 ene 2008 año
59.363
-2.202
-3.58%
1 ene 2009 año
59.017
-0.347
-0.58%
1 ene 2010 año
60.573
+1.556
2.64%
1 ene 2011 año
60.373
-0.2
-0.33%
1 ene 2012 año
58.163
-2.209
-3.66%
Ranking de los países por los datos estadísticos actuales