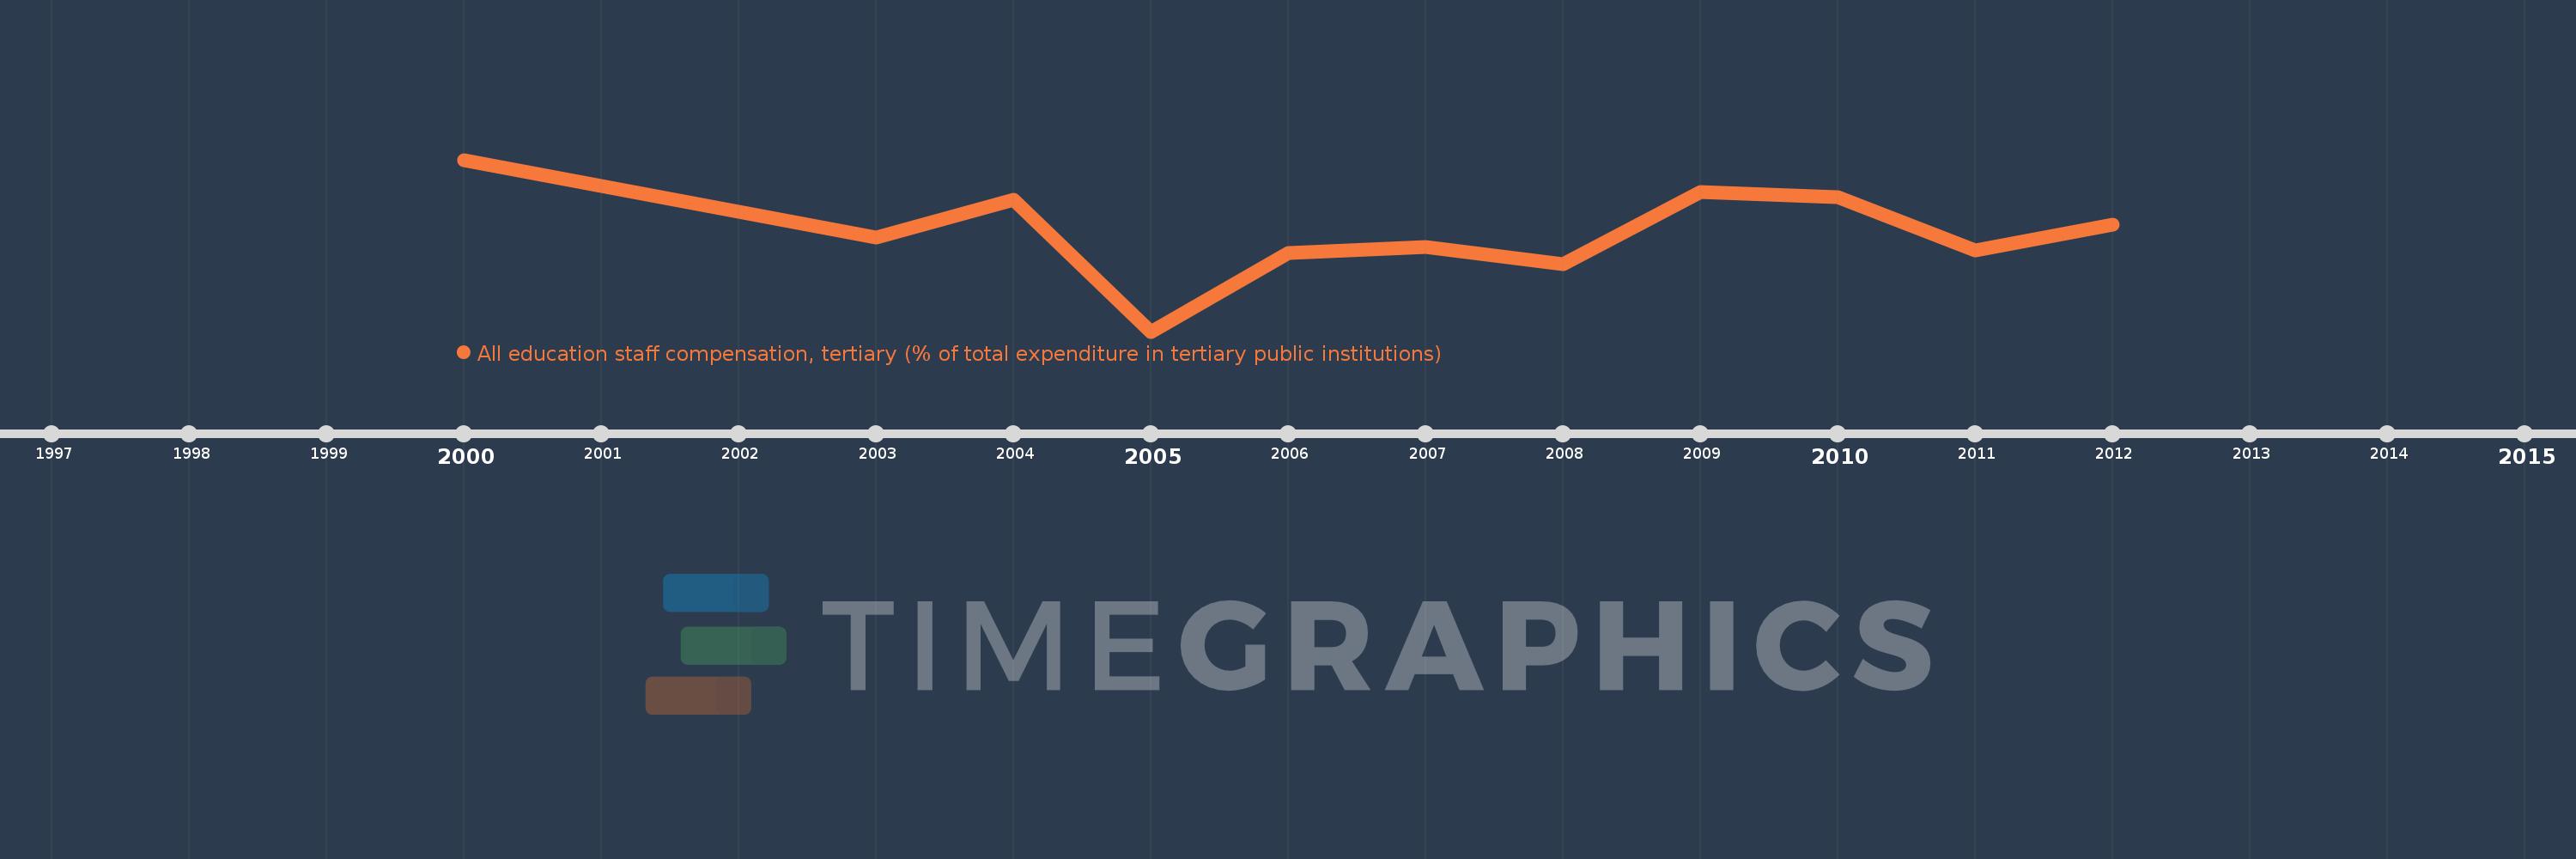
En esta escala de tiempo se presenta un gráfico de 2000 y 2012 de Chile. Los datos de 1999 están ausentes. El número de observaciones reales por fecha: 11.
Fuente (nombre):
Indicadores del desarrollo mundial
Fuente (organización):
United Nations Educational, Scientific, and Cultural Organization (UNESCO) Institute for Statistics.
Categorías:
Education
Se ha actualizado:
23 abr 2017 año
Los indicadores de los cambios de valor en los últimos años
En promedio:
60.114
Mínimo:
55.239
1 ene 2005 año
Máximo:
63.695
1 ene 2000 año
A la fecha de observación
Valor
Cambio absoluto
El cambio con respecto al valor anterior
1 ene 2000 año
63.695
+63.695
0.0%
1 ene 2003 año
59.854
-3.841
-6.03%
1 ene 2004 año
61.729
+1.874
3.13%
1 ene 2005 año
55.239
-6.49
-10.51%
1 ene 2006 año
59.094
+3.855
6.98%
1 ene 2007 año
59.407
+0.313
0.53%
1 ene 2008 año
58.555
-0.852
-1.43%
1 ene 2009 año
62.092
+3.537
6.04%
1 ene 2010 año
61.857
-0.236
-0.38%
1 ene 2011 año
59.24
-2.616
-4.23%
1 ene 2012 año
60.487
+1.247
2.11%
Ranking de los países por los datos estadísticos actuales