33
/es/
AIzaSyB4mHJ5NPEv-XzF7P6NDYXjlkCWaeKw5bc
November 1, 2025
159124
Ireland
IRL
true
2
1
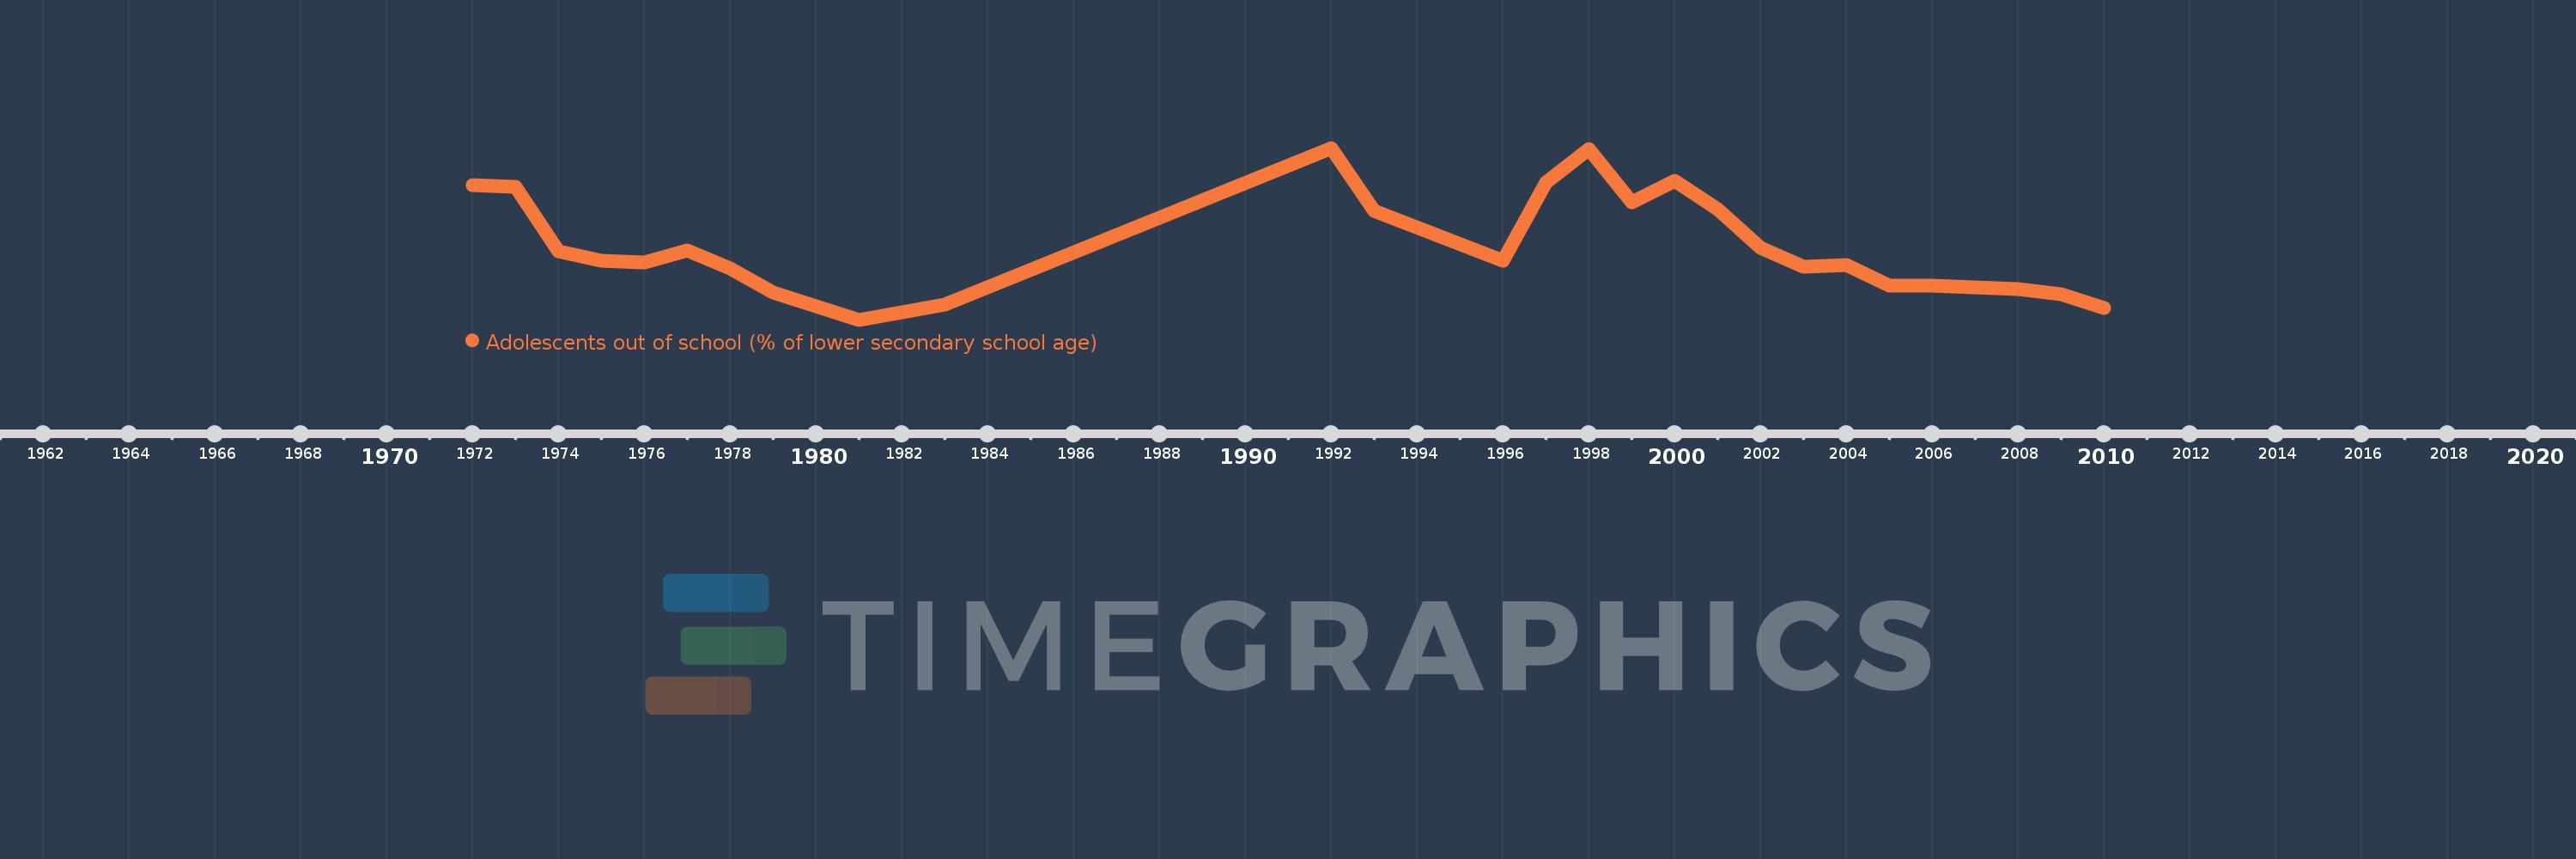
Adolescents out of school (% of lower secondary school age)
2010,2009,2008,2006,2005,2004,2003,2002,2001,2000,1999,1998,1997,1996,1993,1992,1983,1981,1979,1978,1977,1976,1975,1974,1973,1972