29
/es/
es
AIzaSyAYiBZKx7MnpbEhh9jyipgxe19OcubqV5w
April 1, 2024
152912
Hungary
HUN
true
2
1
Oil rents (% of GDP)
2016,2015,2014,2013,2012,2011,2010,2009,2008,2007,2006,2005,2004,2003,2002,2001,2000,1999,1998,1997,1996,1995,1994,1993,1992
Download
Estadísticas Globales de la Biblioteca →Hungary →

Oil rents (% of GDP)

Estas estadísticas en otros países:
AfghanistanAlbaniaAlgeriaAngolaArab WorldArgentinaArmeniaAustraliaAustriaAzerbaijanBahrainBangladeshBarbadosBelarusBelgiumBelizeBeninBoliviaBosnia and HerzegovinaBotswanaBrazilBrunei DarussalamBulgariaCambodiaCameroonCanadaCaribbean small statesCentral Europe and the BalticsChadChileChinaColombiaCongo, Dem. Rep.Congo, Rep.Costa RicaCote d'IvoireCroatiaCubaCyprusCzech RepublicDenmarkDominican RepublicEarly-demographic dividendEast Asia & PacificEast Asia & Pacific (excluding high income)East Asia & Pacific (IDA & IBRD countries)EcuadorEgypt, Arab Rep.El SalvadorEquatorial GuineaEritreaEstoniaEthiopiaEuro areaEurope & Central AsiaEurope & Central Asia (excluding high income)Europe & Central Asia (IDA & IBRD countries)European UnionFinlandFragile and conflict affected situationsFranceGabonGeorgiaGermanyGhanaGreeceGuatemalaHaitiHeavily indebted poor countries (HIPC)High incomeHondurasHungaryIBRD onlyIcelandIDA & IBRD totalIDA blendIDA onlyIDA totalIndiaIndonesiaIran, Islamic Rep.IraqIrelandIsraelItalyJamaicaJapanJordanKazakhstanKenyaKorea, Rep.KosovoKuwaitKyrgyz RepublicLate-demographic dividendLatin America & Caribbean Latin America & Caribbean (excluding high income)Latin America & the Caribbean (IDA & IBRD countries)LatviaLeast developed countries: UN classificationLebanonLibyaLithuaniaLow & middle incomeLower middle incomeLuxembourgMacedonia, FYRMalaysiaMaltaMauritaniaMauritiusMexicoMiddle East & North AfricaMiddle East & North Africa (excluding high income)Middle East & North Africa (IDA & IBRD countries)Middle incomeMongoliaMontenegroMoroccoMozambiqueMyanmarNamibiaNepalNetherlandsNew ZealandNicaraguaNigerNigeriaNorth AmericaNorwayOECD membersOmanOther small statesPakistanPanamaPapua New GuineaParaguayPeruPhilippinesPolandPortugalPost-demographic dividendPre-demographic dividendQatarRomaniaRussian FederationSaudi ArabiaSenegalSerbiaSingaporeSlovak RepublicSloveniaSmall statesSouth AfricaSouth AsiaSouth Asia (IDA & IBRD)South SudanSpainSri LankaSub-Saharan Africa Sub-Saharan Africa (excluding high income)Sub-Saharan Africa (IDA & IBRD countries)SudanSurinameSwedenSwitzerlandSyrian Arab RepublicTajikistanThailandTimor-LesteTogoTrinidad and TobagoTunisiaTurkeyTurkmenistanUkraineUnited Arab EmiratesUnited KingdomUnited StatesUpper middle incomeUruguayUzbekistanVenezuela, RBVietnamWest Bank and GazaWorldYemen, Rep.ZambiaZimbabwe
línea de tiempo (timeline):
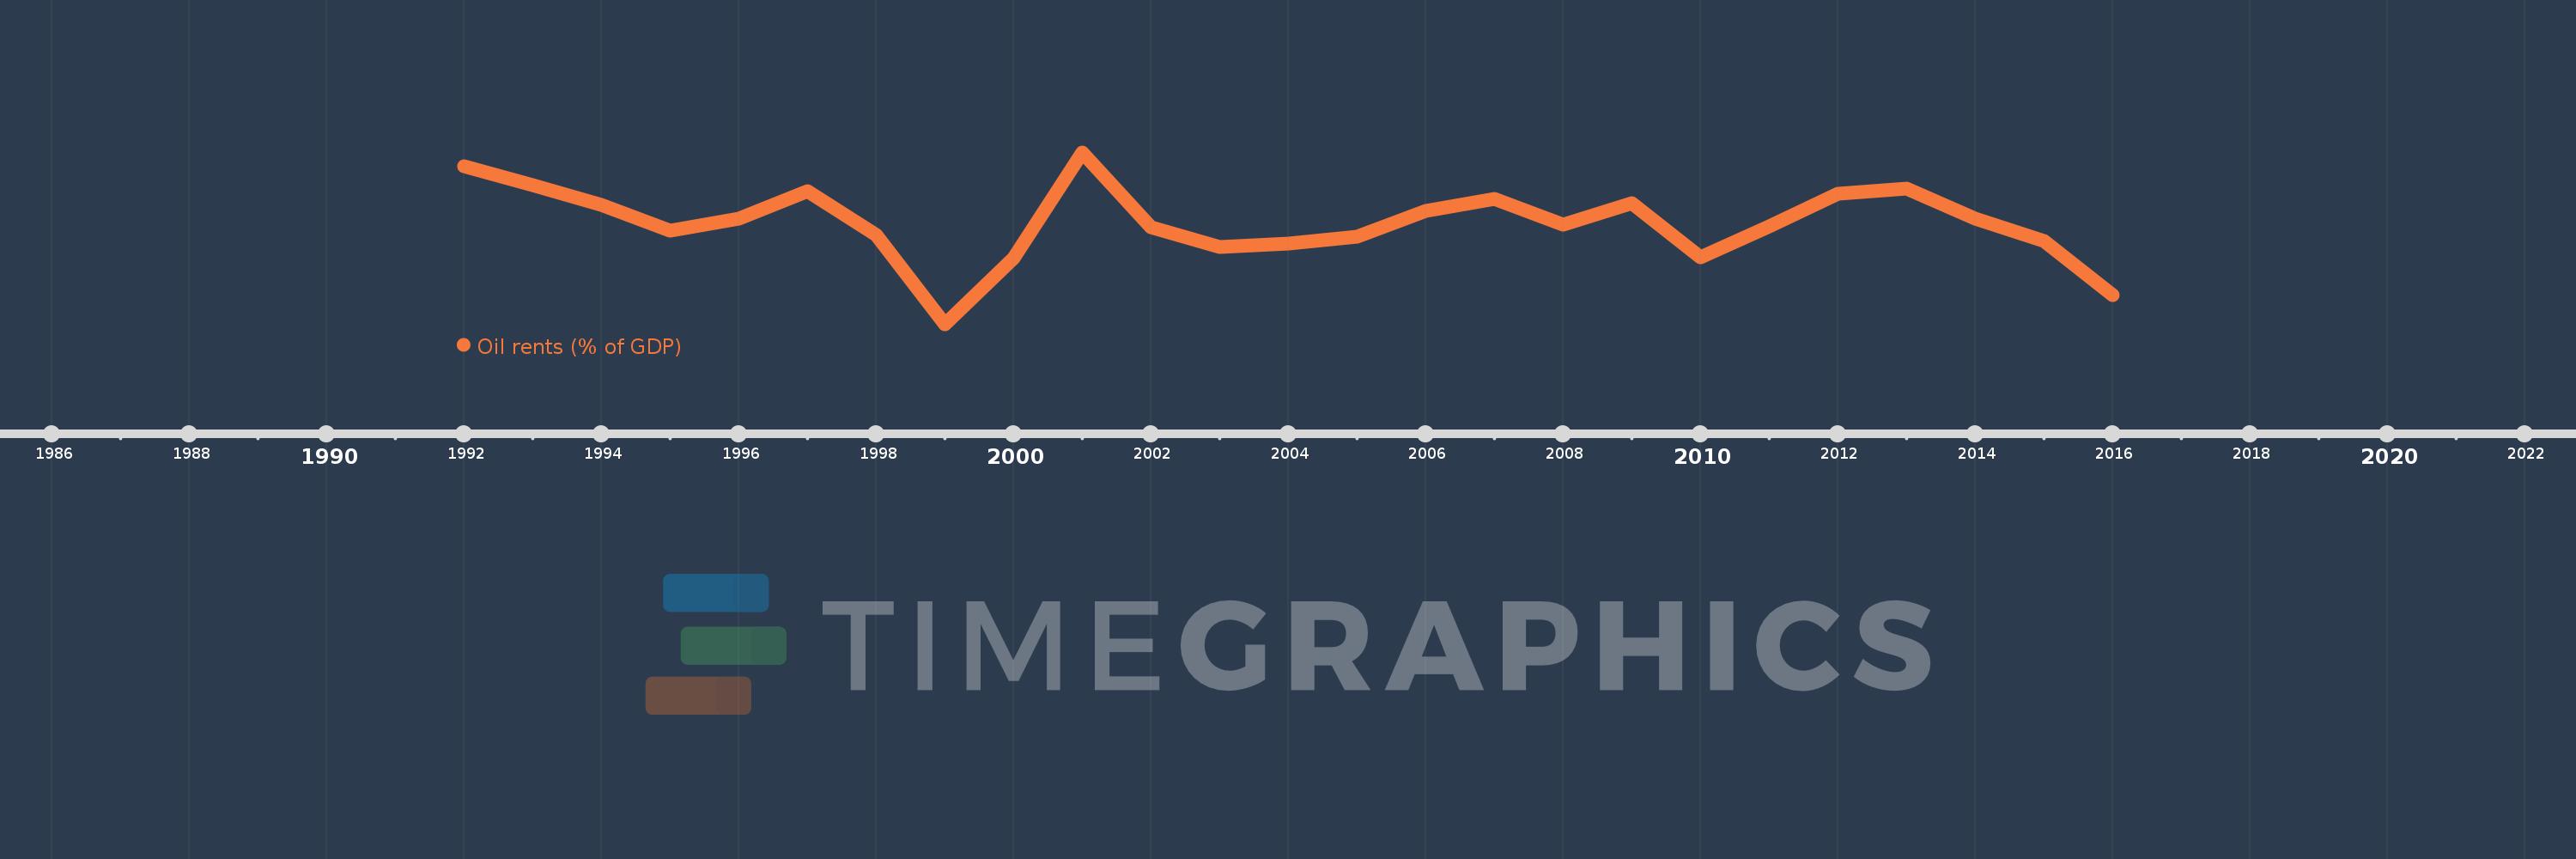
En esta escala de tiempo se presenta un gráfico de 1992 y 2016 de Hungary. Los datos de 1991 están ausentes. El número de observaciones reales por fecha: 25.
Fuente (nombre):
Indicadores del desarrollo mundial
Fuente (organización):
Estimates based on sources and methods described in "The Changing Wealth of Nations: Measuring Sustainable Development in the New Millennium" (World Bank, 2011).
Categorías:
Energy & Mining, Environment
Se ha actualizado:
23 abr 2017 año
Los indicadores de los cambios de valor en los últimos años
En promedio:
0.179
Mínimo:
0.031
1 ene 1999 año
Máximo:
0.282
1 ene 2001 año
A la fecha de observación
Valor
Cambio absoluto
El cambio con respecto al valor anterior
1 ene 1992 año
0.262
+0.262
0.0%
1 ene 1993 año
0.234
-0.027
-10.49%
1 ene 1994 año
0.205
-0.029
-12.34%
1 ene 1995 año
0.168
-0.038
-18.44%
1 ene 1996 año
0.185
+0.017
10.16%
1 ene 1997 año
0.225
+0.041
22.01%
1 ene 1998 año
0.161
-0.064
-28.43%
1 ene 1999 año
0.031
-0.13
-80.9%
1 ene 2000 año
0.127
+0.096
311.22%
1 ene 2001 año
0.282
+0.155
122.43%
1 ene 2002 año
0.173
-0.109
-38.71%
1 ene 2003 año
0.144
-0.028
-16.32%
1 ene 2004 año
0.149
+0.005
3.13%
1 ene 2005 año
0.159
+0.01
6.72%
1 ene 2006 año
0.196
+0.037
23.6%
1 ene 2007 año
0.214
+0.018
8.96%
1 ene 2008 año
0.176
-0.037
-17.52%
1 ene 2009 año
0.208
+0.032
17.87%
1 ene 2010 año
0.129
-0.079
-37.94%
1 ene 2011 año
0.174
+0.045
34.77%
1 ene 2012 año
0.222
+0.048
27.51%
1 ene 2013 año
0.229
+0.007
3.26%
1 ene 2014 año
0.185
-0.044
-19.33%
1 ene 2015 año
0.153
-0.031
-17.03%
1 ene 2016 año
0.074
-0.079
-51.82%
Ranking de los países por los datos estadísticos actuales

Comentarios:

Enviar
PremiumAbout & FeedbackAcuerdoPrivacidad
logo
© 2022 Selected Technologies LLC – Morgan Hill, California