33
/es/
AIzaSyAYiBZKx7MnpbEhh9jyipgxe19OcubqV5w
August 1, 2025
118272
Czech Republic
CZE
true
2
1
Oil rents (% of GDP)
2016,2015,2014,2013,2012,2011,2010,2009,2008,2007,2006,2005,2004,2003,2002,2001,2000,1999,1998,1997,1996,1995,1994,1993,1992,1991
Download
Estadísticas Globales de la Biblioteca →Czech Republic →

Oil rents (% of GDP)

Estas estadísticas en otros países:

AfghanistanAlbaniaAlgeriaAngolaArab WorldArgentinaArmeniaAustraliaAustriaAzerbaijanBahrainBangladeshBarbadosBelarusBelgiumBelizeBeninBoliviaBosnia and HerzegovinaBotswanaBrazilBrunei DarussalamBulgariaCambodiaCameroonCanadaCaribbean small statesCentral Europe and the BalticsChadChileChinaColombiaCongo, Dem. Rep.Congo, Rep.Costa RicaCote d'IvoireCroatiaCubaCyprusCzech RepublicDenmarkDominican RepublicEarly-demographic dividendEast Asia & PacificEast Asia & Pacific (excluding high income)East Asia & Pacific (IDA & IBRD countries)EcuadorEgypt, Arab Rep.El SalvadorEquatorial GuineaEritreaEstoniaEthiopiaEuro areaEurope & Central AsiaEurope & Central Asia (excluding high income)Europe & Central Asia (IDA & IBRD countries)European UnionFinlandFragile and conflict affected situationsFranceGabonGeorgiaGermanyGhanaGreeceGuatemalaHaitiHeavily indebted poor countries (HIPC)High incomeHondurasHungaryIBRD onlyIcelandIDA & IBRD totalIDA blendIDA onlyIDA totalIndiaIndonesiaIran, Islamic Rep.IraqIrelandIsraelItalyJamaicaJapanJordanKazakhstanKenyaKorea, Rep.KosovoKuwaitKyrgyz RepublicLate-demographic dividendLatin America & Caribbean Latin America & Caribbean (excluding high income)Latin America & the Caribbean (IDA & IBRD countries)LatviaLeast developed countries: UN classificationLebanonLibyaLithuaniaLow & middle incomeLower middle incomeLuxembourgMacedonia, FYRMalaysiaMaltaMauritaniaMauritiusMexicoMiddle East & North AfricaMiddle East & North Africa (excluding high income)Middle East & North Africa (IDA & IBRD countries)Middle incomeMongoliaMontenegroMoroccoMozambiqueMyanmarNamibiaNepalNetherlandsNew ZealandNicaraguaNigerNigeriaNorth AmericaNorwayOECD membersOmanOther small statesPakistanPanamaPapua New GuineaParaguayPeruPhilippinesPolandPortugalPost-demographic dividendPre-demographic dividendQatarRomaniaRussian FederationSaudi ArabiaSenegalSerbiaSingaporeSlovak RepublicSloveniaSmall statesSouth AfricaSouth AsiaSouth Asia (IDA & IBRD)South SudanSpainSri LankaSub-Saharan Africa Sub-Saharan Africa (excluding high income)Sub-Saharan Africa (IDA & IBRD countries)SudanSurinameSwedenSwitzerlandSyrian Arab RepublicTajikistanThailandTimor-LesteTogoTrinidad and TobagoTunisiaTurkeyTurkmenistanUkraineUnited Arab EmiratesUnited KingdomUnited StatesUpper middle incomeUruguayUzbekistanVenezuela, RBVietnamWest Bank and GazaWorldYemen, Rep.ZambiaZimbabwe

línea de tiempo (timeline):

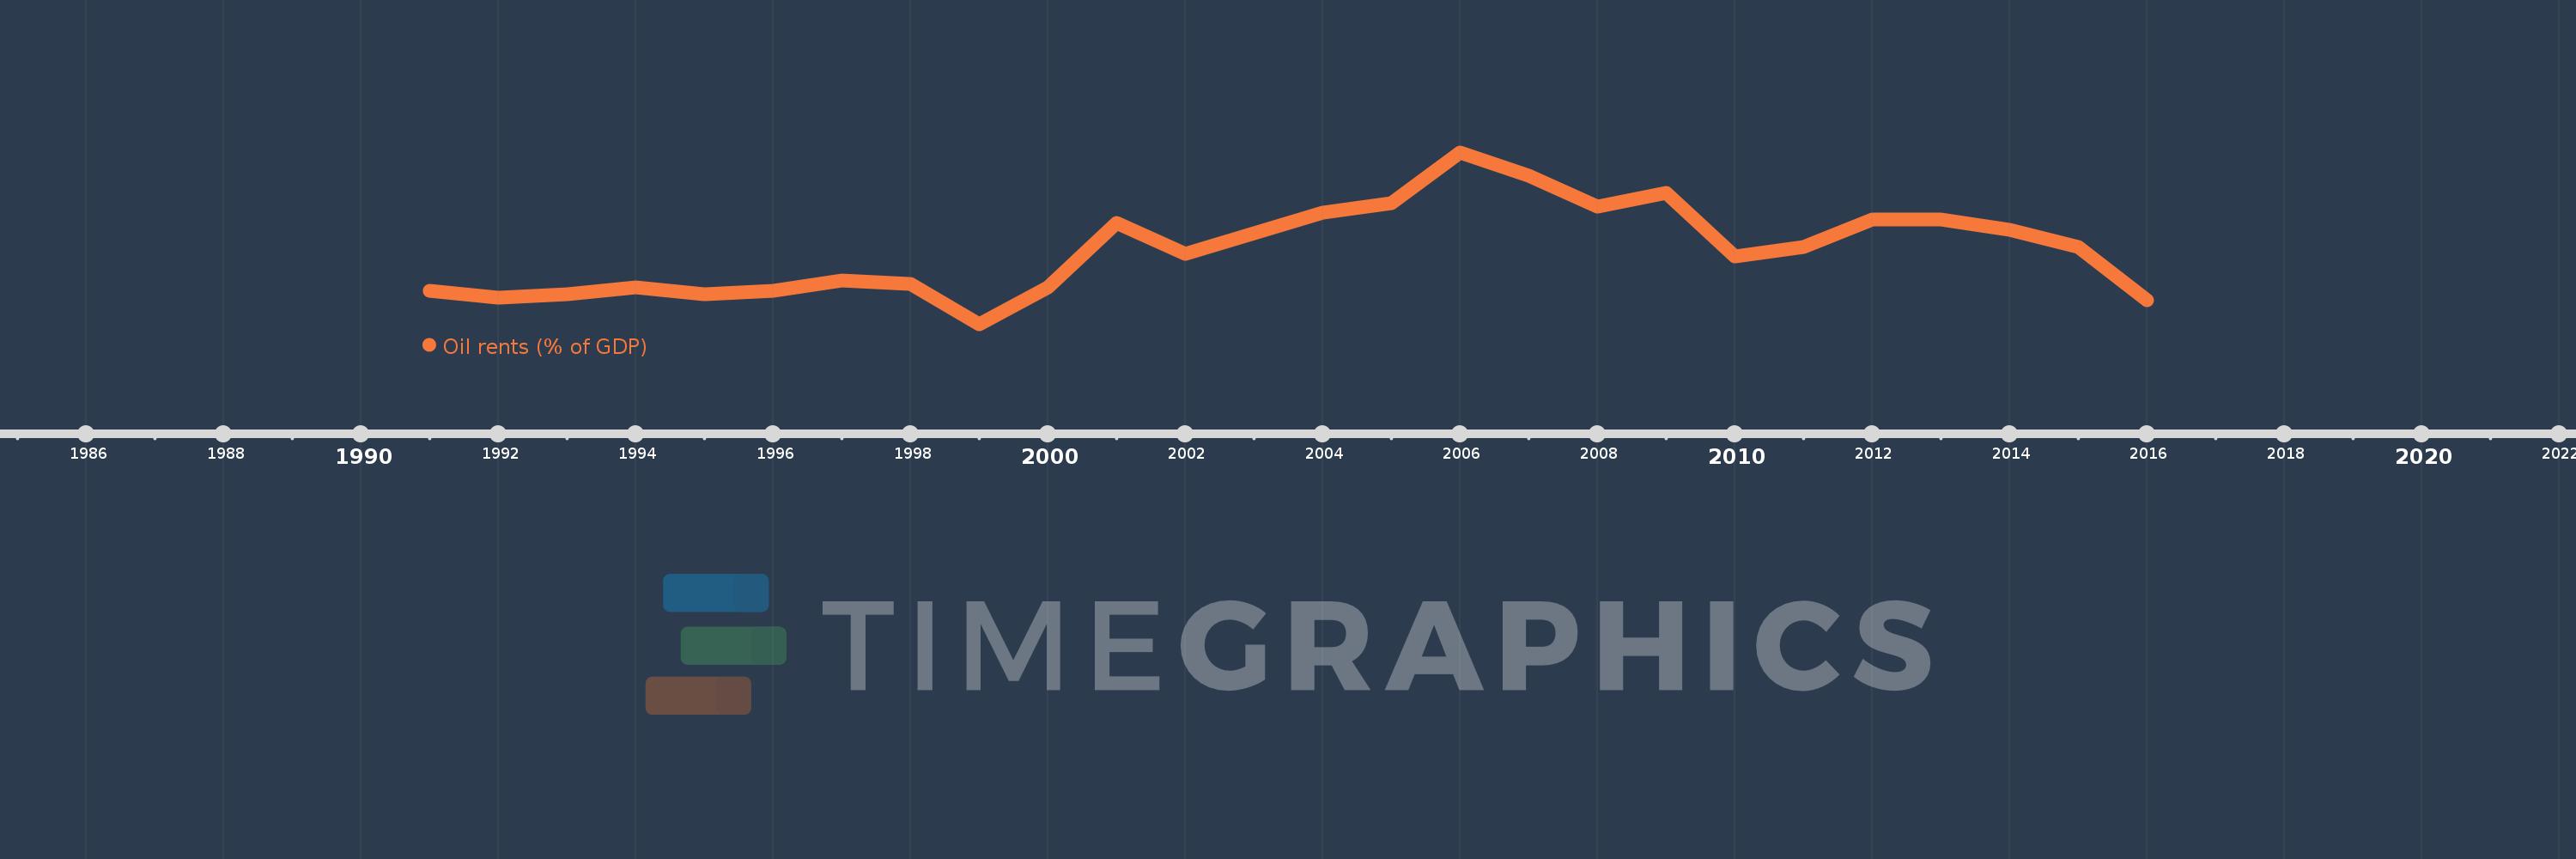
En esta escala de tiempo se presenta un gráfico de 1991 y 2016 de Czech Republic. Los datos de 1990 están ausentes. El número de observaciones reales por fecha: 26.

Fuente (nombre):

Indicadores del desarrollo mundial

Fuente (organización):

Estimates based on sources and methods described in "The Changing Wealth of Nations: Measuring Sustainable Development in the New Millennium" (World Bank, 2011).

Categorías:

Energy & Mining, Environment

Se ha actualizado:

23 abr 2017 año

Los indicadores de los cambios de valor en los últimos años

En promedio:
0.025
Mínimo:
0.003
1 ene 1999 año
Máximo:
0.054
1 ene 2006 año
A la fecha de observación
Valor
Cambio absoluto
El cambio con respecto al valor anterior
1 ene 1991 año
0.013
+0.013
0.0%
1 ene 1992 año
0.011
-0.002
-11.93%
1 ene 1993 año
0.012
+0.001
5.84%
1 ene 1994 año
0.014
+0.001
11.98%
1 ene 1995 año
0.012
-0.001
-9.25%
1 ene 1996 año
0.013
+0.0
1.52%
1 ene 1997 año
0.016
+0.004
28.59%
1 ene 1998 año
0.015
-0.001
-8.44%
1 ene 1999 año
0.003
-0.012
-78.32%
1 ene 2000 año
0.014
+0.011
340.75%
1 ene 2001 año
0.033
+0.019
135.71%
1 ene 2002 año
0.024
-0.01
-29.06%
1 ene 2003 año
0.03
+0.007
27.53%
1 ene 2004 año
0.036
+0.006
18.3%
1 ene 2005 año
0.039
+0.004
10.38%
1 ene 2006 año
0.054
+0.014
36.44%
1 ene 2007 año
0.047
-0.006
-11.82%
1 ene 2008 año
0.038
-0.009
-19.41%
1 ene 2009 año
0.042
+0.003
8.81%
1 ene 2010 año
0.023
-0.019
-44.86%
1 ene 2011 año
0.026
+0.003
14.68%
1 ene 2012 año
0.034
+0.008
30.05%
1 ene 2013 año
0.034
0.0
-0.97%
1 ene 2014 año
0.031
-0.003
-9.61%
1 ene 2015 año
0.026
-0.004
-13.62%
1 ene 2016 año
0.01
-0.016
-60.82%

Ranking de los países por los datos estadísticos actuales