29
/es/
es
AIzaSyAYiBZKx7MnpbEhh9jyipgxe19OcubqV5w
April 1, 2024
152235
Hungary
HUN
true
2
1
Agriculture, value added (constant LCU)
2016,2015,2014,2013,2012,2011,2010,2009,2008,2007,2006,2005,2004,2003,2002,2001,2000,1999,1998,1997,1996
Download
Estadísticas Globales de la Biblioteca →Hungary →

Agriculture, value added (constant LCU)

Estas estadísticas en otros países:
AfghanistanAlbaniaAlgeriaAntigua and BarbudaArgentinaArmeniaAustraliaAustriaAzerbaijanBahamas, TheBahrainBangladeshBelarusBelgiumBelizeBeninBermudaBhutanBoliviaBosnia and HerzegovinaBotswanaBrazilBrunei DarussalamBulgariaBurkina FasoBurundiCabo VerdeCambodiaCameroonCanadaCayman IslandsCentral African RepublicChadChileChinaColombiaComorosCongo, Dem. Rep.Congo, Rep.Costa RicaCote d'IvoireCroatiaCubaCyprusCzech RepublicDenmarkDjiboutiDominicaDominican RepublicEcuadorEgypt, Arab Rep.El SalvadorEquatorial GuineaEritreaEstoniaEthiopiaFijiFinlandFranceGabonGambia, TheGeorgiaGermanyGhanaGreeceGrenadaGuatemalaGuineaGuinea-BissauGuyanaHaitiHondurasHong Kong SAR, ChinaHungaryIcelandIndiaIndonesiaIran, Islamic Rep.IraqIrelandItalyJamaicaJapanJordanKazakhstanKenyaKiribatiKorea, Rep.KosovoKuwaitKyrgyz RepublicLao PDRLatviaLebanonLesothoLiberiaLithuaniaLuxembourgMacedonia, FYRMadagascarMalawiMalaysiaMaldivesMaliMarshall IslandsMauritaniaMauritiusMexicoMicronesia, Fed. Sts.MoldovaMongoliaMontenegroMoroccoMozambiqueMyanmarNamibiaNepalNetherlandsNew ZealandNicaraguaNigerNigeriaNorwayOmanPakistanPalauPanamaPapua New GuineaParaguayPeruPhilippinesPolandPortugalPuerto RicoQatarRomaniaRussian FederationRwandaSamoaSao Tome and PrincipeSaudi ArabiaSenegalSerbiaSeychellesSierra LeoneSingaporeSlovak RepublicSloveniaSolomon IslandsSomaliaSouth AfricaSpainSri LankaSt. Kitts and NevisSt. LuciaSt. Vincent and the GrenadinesSudanSurinameSwazilandSwedenSwitzerlandSyrian Arab RepublicTajikistanTanzaniaThailandTimor-LesteTogoTongaTrinidad and TobagoTunisiaTurkeyTurkmenistanTuvaluUgandaUkraineUnited Arab EmiratesUnited KingdomUnited StatesUruguayUzbekistanVanuatuVenezuela, RBVietnamWest Bank and GazaZambiaZimbabwe
línea de tiempo (timeline):
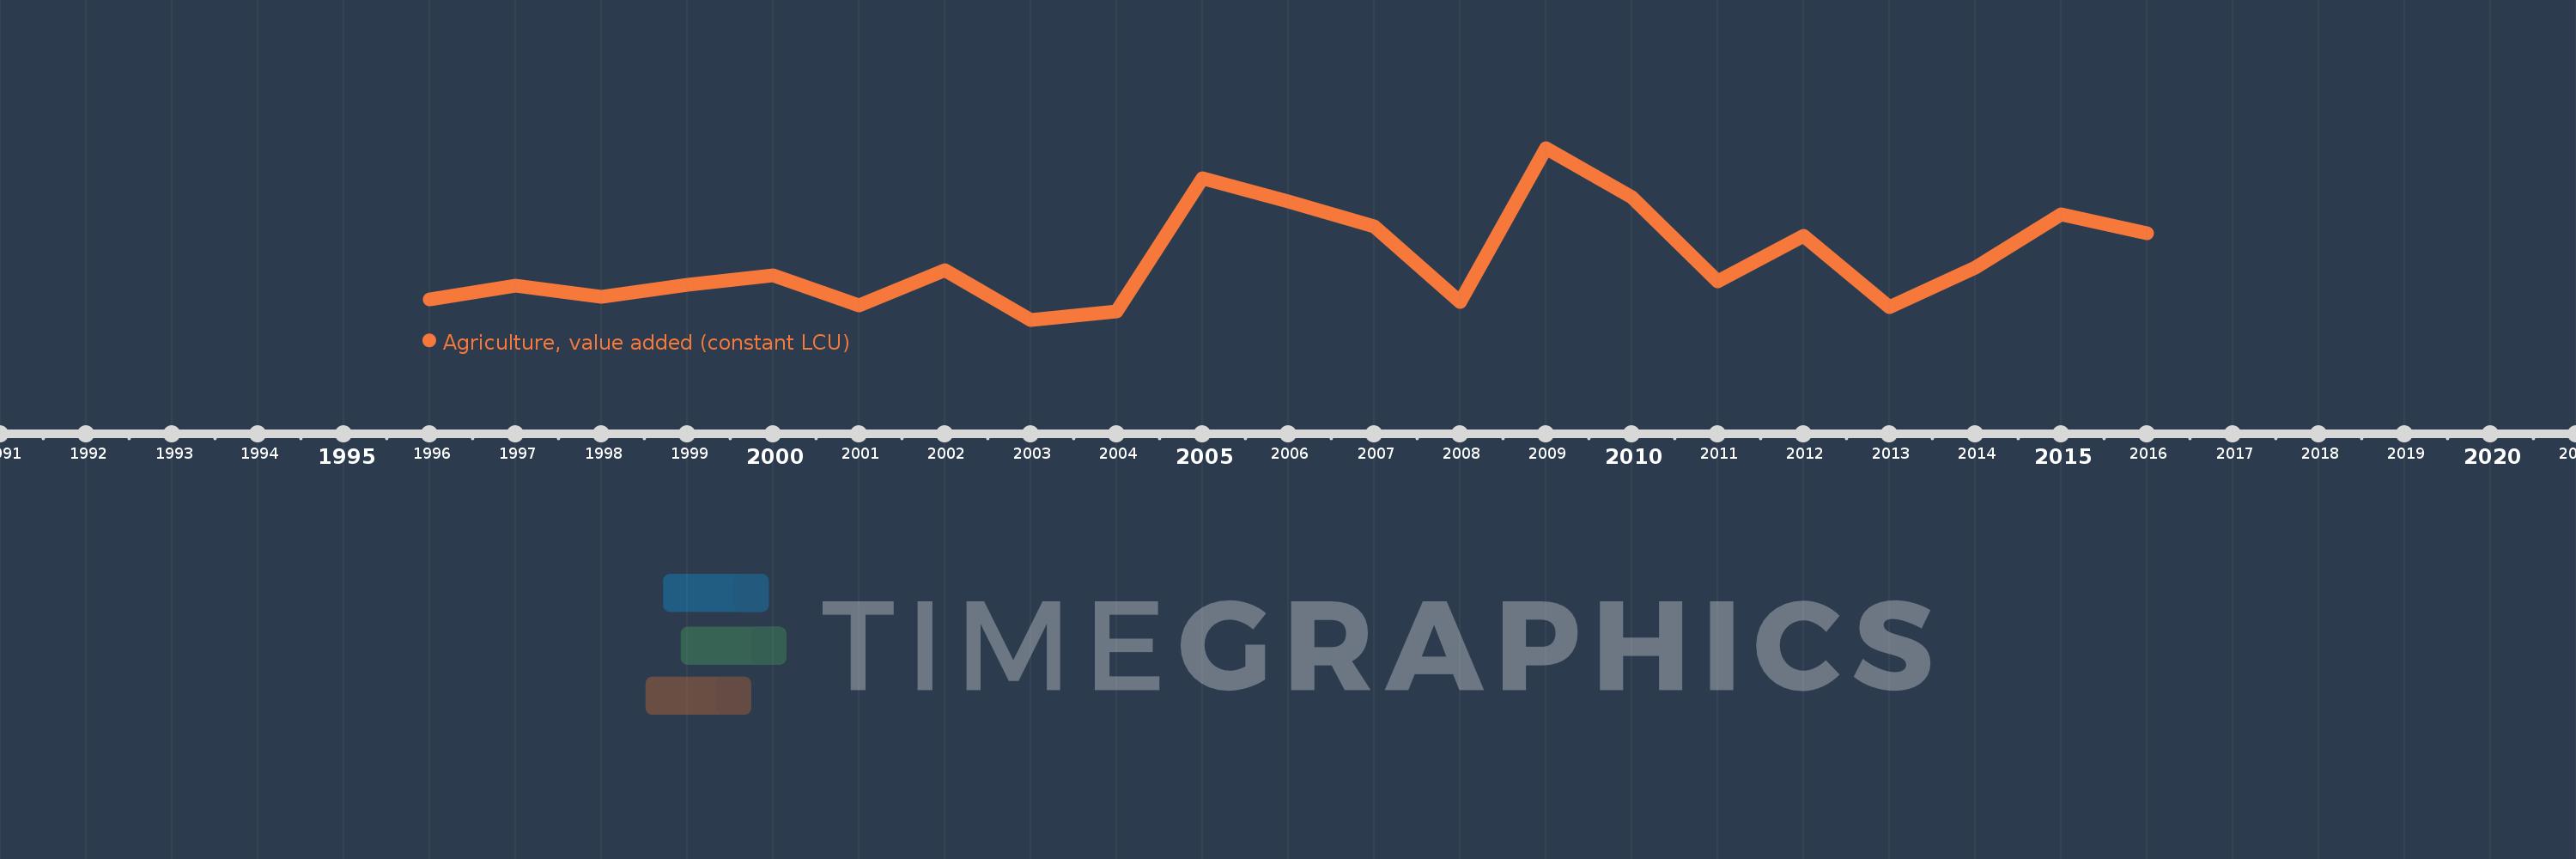
En esta escala de tiempo se presenta un gráfico de 1996 y 2016 de Hungary. Los datos de 1995 están ausentes. El número de observaciones reales por fecha: 21.
Fuente (nombre):
Indicadores del desarrollo mundial
Fuente (organización):
World Bank national accounts data, and OECD National Accounts data files.
Categorías:
Economy & Growth
Se ha actualizado:
23 abr 2017 año
Los indicadores de los cambios de valor en los últimos años
En promedio:
873.808 bn
Mínimo:
707.326 bn
1 ene 2003 año
Máximo:
1.178 billones
1 ene 2009 año
A la fecha de observación
Valor
Cambio absoluto
El cambio con respecto al valor anterior
1 ene 1996 año
764.267 bn
+764.267 bn
0.0%
1 ene 1997 año
801.754 bn
+37.487 bn
4.9%
1 ene 1998 año
769.947 bn
-31.807 bn
-3.97%
1 ene 1999 año
804.171 bn
+34.223 bn
4.44%
1 ene 2000 año
829.731 bn
+25.56 bn
3.18%
1 ene 2001 año
746.734 bn
-82.997 bn
-10.0%
1 ene 2002 año
842.9 bn
+96.166 bn
12.88%
1 ene 2003 año
707.326 bn
-135.574 bn
-16.08%
1 ene 2004 año
729.693 bn
+22.367 bn
3.16%
1 ene 2005 año
1.095 billones
+365.144 bn
50.04%
1 ene 2006 año
1.032 billones
-62.82 bn
-5.74%
1 ene 2007 año
964.194 bn
-67.823 bn
-6.57%
1 ene 2008 año
757.066 bn
-207.128 bn
-21.48%
1 ene 2009 año
1.178 billones
+421.055 bn
55.62%
1 ene 2010 año
1.044 billones
-134.099 bn
-11.38%
1 ene 2011 año
812.897 bn
-231.124 bn
-22.14%
1 ene 2012 año
938.146 bn
+125.249 bn
15.41%
1 ene 2013 año
741.628 bn
-196.518 bn
-20.95%
1 ene 2014 año
850.672 bn
+109.044 bn
14.7%
1 ene 2015 año
995.132 bn
+144.459 bn
16.98%
1 ene 2016 año
944.714 bn
-50.417 bn
-5.07%
Ranking de los países por los datos estadísticos actuales

Comentarios:

Enviar
PremiumAbout & FeedbackAcuerdoPrivacidad
logo
© 2022 Selected Technologies LLC – Morgan Hill, California