29
/es/
es
AIzaSyAYiBZKx7MnpbEhh9jyipgxe19OcubqV5w
April 1, 2024
117620
Czech Republic
CZE
true
2
1
Agriculture, value added (constant LCU)
2016,2015,2014,2013,2012,2011,2010,2009,2008,2007,2006,2005,2004,2003,2002,2001,2000,1999,1998,1997,1996,1995,1994
Download
Estadísticas Globales de la Biblioteca →Czech Republic →

Agriculture, value added (constant LCU)

Estas estadísticas en otros países:
AfghanistanAlbaniaAlgeriaAntigua and BarbudaArgentinaArmeniaAustraliaAustriaAzerbaijanBahamas, TheBahrainBangladeshBelarusBelgiumBelizeBeninBermudaBhutanBoliviaBosnia and HerzegovinaBotswanaBrazilBrunei DarussalamBulgariaBurkina FasoBurundiCabo VerdeCambodiaCameroonCanadaCayman IslandsCentral African RepublicChadChileChinaColombiaComorosCongo, Dem. Rep.Congo, Rep.Costa RicaCote d'IvoireCroatiaCubaCyprusCzech RepublicDenmarkDjiboutiDominicaDominican RepublicEcuadorEgypt, Arab Rep.El SalvadorEquatorial GuineaEritreaEstoniaEthiopiaFijiFinlandFranceGabonGambia, TheGeorgiaGermanyGhanaGreeceGrenadaGuatemalaGuineaGuinea-BissauGuyanaHaitiHondurasHong Kong SAR, ChinaHungaryIcelandIndiaIndonesiaIran, Islamic Rep.IraqIrelandItalyJamaicaJapanJordanKazakhstanKenyaKiribatiKorea, Rep.KosovoKuwaitKyrgyz RepublicLao PDRLatviaLebanonLesothoLiberiaLithuaniaLuxembourgMacedonia, FYRMadagascarMalawiMalaysiaMaldivesMaliMarshall IslandsMauritaniaMauritiusMexicoMicronesia, Fed. Sts.MoldovaMongoliaMontenegroMoroccoMozambiqueMyanmarNamibiaNepalNetherlandsNew ZealandNicaraguaNigerNigeriaNorwayOmanPakistanPalauPanamaPapua New GuineaParaguayPeruPhilippinesPolandPortugalPuerto RicoQatarRomaniaRussian FederationRwandaSamoaSao Tome and PrincipeSaudi ArabiaSenegalSerbiaSeychellesSierra LeoneSingaporeSlovak RepublicSloveniaSolomon IslandsSomaliaSouth AfricaSpainSri LankaSt. Kitts and NevisSt. LuciaSt. Vincent and the GrenadinesSudanSurinameSwazilandSwedenSwitzerlandSyrian Arab RepublicTajikistanTanzaniaThailandTimor-LesteTogoTongaTrinidad and TobagoTunisiaTurkeyTurkmenistanTuvaluUgandaUkraineUnited Arab EmiratesUnited KingdomUnited StatesUruguayUzbekistanVanuatuVenezuela, RBVietnamWest Bank and GazaZambiaZimbabwe
línea de tiempo (timeline):
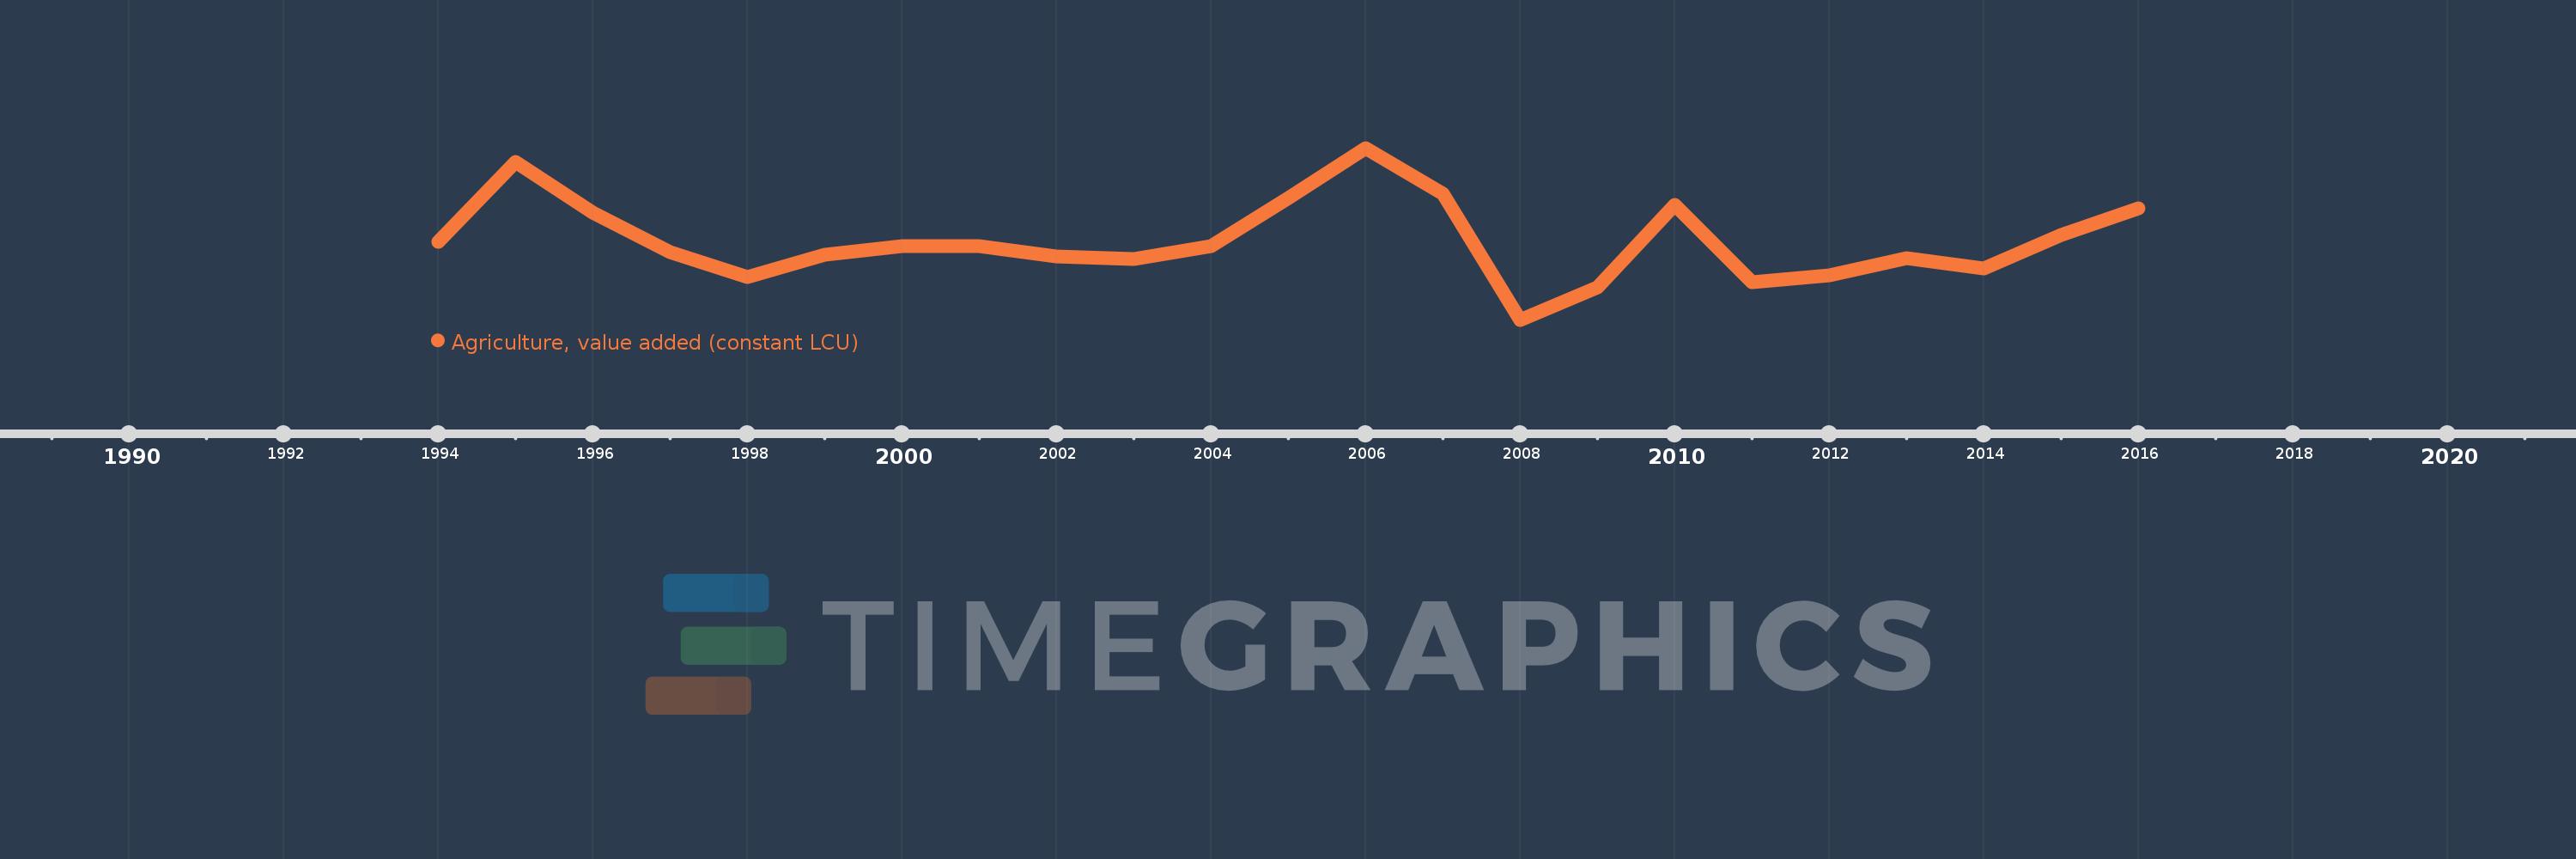
En esta escala de tiempo se presenta un gráfico de 1994 y 2016 de Czech Republic. Los datos de 1993 están ausentes. El número de observaciones reales por fecha: 23.
Fuente (nombre):
Indicadores del desarrollo mundial
Fuente (organización):
World Bank national accounts data, and OECD National Accounts data files.
Categorías:
Economy & Growth
Se ha actualizado:
23 abr 2017 año
Los indicadores de los cambios de valor en los últimos años
En promedio:
66.513 bn
Mínimo:
54.657 bn
1 ene 2008 año
Máximo:
80.391 bn
1 ene 2006 año
A la fecha de observación
Valor
Cambio absoluto
El cambio con respecto al valor anterior
1 ene 1994 año
66.292 bn
+66.292 bn
0.0%
1 ene 1995 año
78.327 bn
+12.035 bn
18.15%
1 ene 1996 año
70.756 bn
-7.571 bn
-9.67%
1 ene 1997 año
64.83 bn
-5.926 bn
-8.38%
1 ene 1998 año
61.001 bn
-3.829 bn
-5.91%
1 ene 1999 año
64.374 bn
+3.373 bn
5.53%
1 ene 2000 año
65.632 bn
+1.258 bn
1.95%
1 ene 2001 año
65.65 bn
+18.0 millones
0.03%
1 ene 2002 año
64.153 bn
-1.497 bn
-2.28%
1 ene 2003 año
63.728 bn
-425.0 millones
-0.66%
1 ene 2004 año
65.626 bn
+1.898 bn
2.98%
1 ene 2005 año
72.87 bn
+7.244 bn
11.04%
1 ene 2006 año
80.391 bn
+7.521 bn
10.32%
1 ene 2007 año
73.486 bn
-6.905 bn
-8.59%
1 ene 2008 año
54.657 bn
-18.829 bn
-25.62%
1 ene 2009 año
59.555 bn
+4.898 bn
8.96%
1 ene 2010 año
71.916 bn
+12.361 bn
20.76%
1 ene 2011 año
60.217 bn
-11.699 bn
-16.27%
1 ene 2012 año
61.372 bn
+1.155 bn
1.92%
1 ene 2013 año
63.9 bn
+2.528 bn
4.12%
1 ene 2014 año
62.339 bn
-1.561 bn
-2.44%
1 ene 2015 año
67.368 bn
+5.029 bn
8.07%
1 ene 2016 año
71.368 bn
+4.0 bn
5.94%
Ranking de los países por los datos estadísticos actuales

Comentarios:

Enviar
PremiumAbout & FeedbackAcuerdoPrivacidad
logo
© 2022 Selected Technologies LLC – Morgan Hill, California