33
/es/
AIzaSyAYiBZKx7MnpbEhh9jyipgxe19OcubqV5w
August 1, 2025
117936
Czech Republic
CZE
true
2
1
Goods imports (BoP, current US$)
2016,2015,2014,2013,2012,2011,2010,2009,2008,2007,2006,2005,2004,2003,2002,2001,2000,1999,1998,1997,1996,1995,1994
Download
Estadísticas Globales de la Biblioteca →Czech Republic →

Goods imports (BoP, current US$)

Estas estadísticas en otros países:

AfghanistanAlbaniaAlgeriaAngolaAntigua and BarbudaArab WorldArgentinaArmeniaArubaAustraliaAustriaAzerbaijanBahamas, TheBahrainBangladeshBarbadosBelarusBelgiumBelizeBeninBermudaBhutanBoliviaBosnia and HerzegovinaBotswanaBrazilBrunei DarussalamBulgariaBurkina FasoBurundiCabo VerdeCambodiaCameroonCanadaCaribbean small statesCentral African RepublicCentral Europe and the BalticsChadChileChinaColombiaComorosCongo, Dem. Rep.Congo, Rep.Costa RicaCote d'IvoireCroatiaCuracaoCyprusCzech RepublicDenmarkDjiboutiDominicaDominican RepublicEarly-demographic dividendEast Asia & PacificEast Asia & Pacific (excluding high income)East Asia & Pacific (IDA & IBRD countries)EcuadorEgypt, Arab Rep.El SalvadorEquatorial GuineaEritreaEstoniaEthiopiaEuro areaEurope & Central AsiaEurope & Central Asia (excluding high income)Europe & Central Asia (IDA & IBRD countries)European UnionFaroe IslandsFijiFinlandFragile and conflict affected situationsFranceFrench PolynesiaGabonGambia, TheGeorgiaGermanyGhanaGreeceGrenadaGuatemalaGuineaGuinea-BissauGuyanaHaitiHeavily indebted poor countries (HIPC)High incomeHondurasHong Kong SAR, ChinaHungaryIBRD onlyIcelandIDA & IBRD totalIDA blendIDA onlyIDA totalIndiaIndonesiaIran, Islamic Rep.IraqIrelandIsraelItalyJamaicaJapanJordanKazakhstanKenyaKiribatiKorea, Rep.KosovoKuwaitKyrgyz RepublicLao PDRLate-demographic dividendLatin America & Caribbean Latin America & Caribbean (excluding high income)Latin America & the Caribbean (IDA & IBRD countries)LatviaLeast developed countries: UN classificationLebanonLesothoLiberiaLibyaLithuaniaLow & middle incomeLow incomeLower middle incomeLuxembourgMacao SAR, ChinaMacedonia, FYRMadagascarMalawiMalaysiaMaldivesMaliMaltaMarshall IslandsMauritaniaMauritiusMexicoMicronesia, Fed. Sts.Middle East & North Africa (excluding high income)Middle East & North Africa (IDA & IBRD countries)Middle incomeMoldovaMongoliaMontenegroMoroccoMozambiqueMyanmarNamibiaNepalNetherlandsNew CaledoniaNew ZealandNicaraguaNigerNigeriaNorth AmericaNorwayOECD membersOmanOther small statesPacific island small statesPakistanPalauPanamaPapua New GuineaParaguayPeruPhilippinesPolandPortugalPost-demographic dividendPre-demographic dividendQatarRomaniaRussian FederationRwandaSamoaSao Tome and PrincipeSaudi ArabiaSenegalSerbiaSeychellesSierra LeoneSingaporeSint Maarten (Dutch part)Slovak RepublicSloveniaSmall statesSolomon IslandsSouth AfricaSouth AsiaSouth Asia (IDA & IBRD)South SudanSpainSri LankaSt. Kitts and NevisSt. LuciaSt. Vincent and the GrenadinesSub-Saharan Africa Sub-Saharan Africa (excluding high income)Sub-Saharan Africa (IDA & IBRD countries)SudanSurinameSwazilandSwedenSwitzerlandSyrian Arab RepublicTajikistanTanzaniaThailandTimor-LesteTogoTongaTrinidad and TobagoTunisiaTurkeyTuvaluUgandaUkraineUnited KingdomUnited StatesUpper middle incomeUruguayVanuatuVenezuela, RBVietnamWest Bank and GazaWorldYemen, Rep.ZambiaZimbabwe

línea de tiempo (timeline):

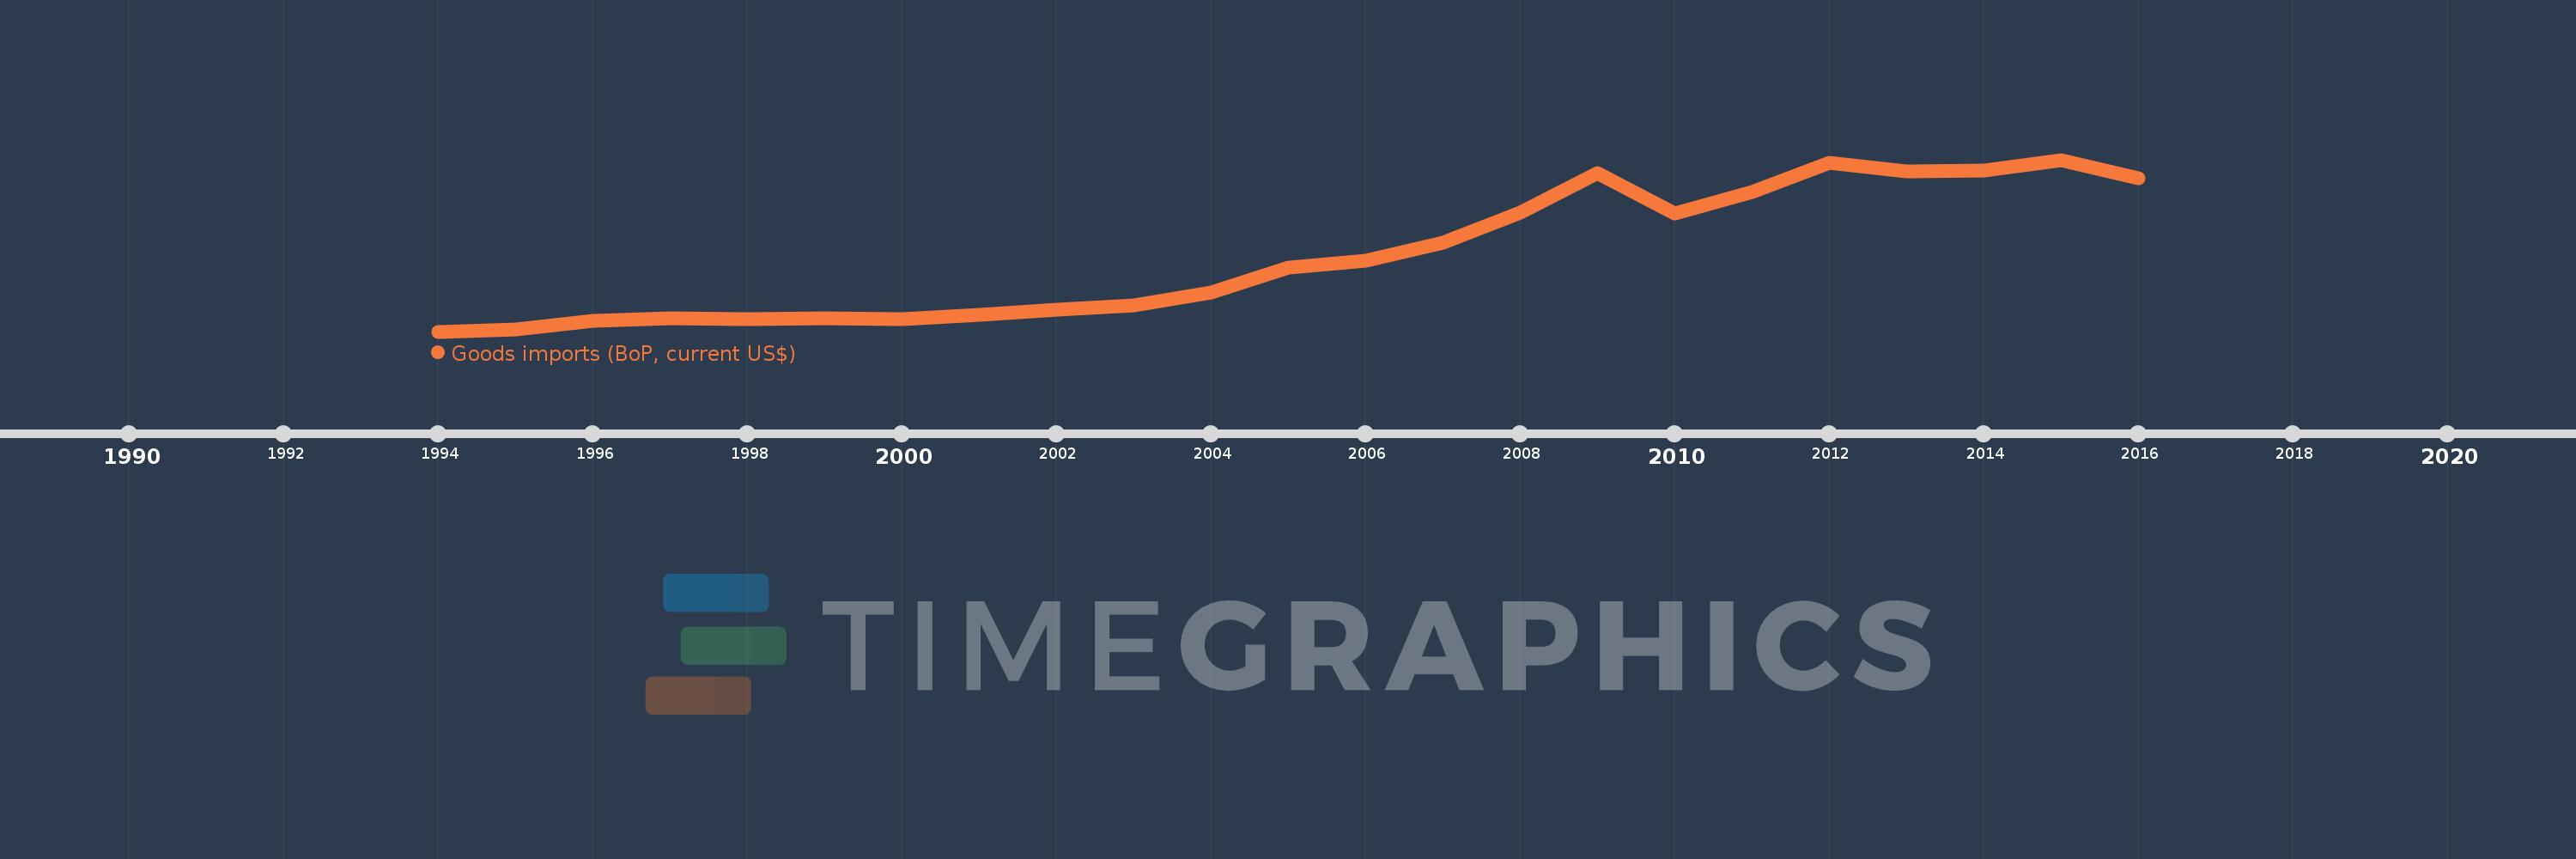
En esta escala de tiempo se presenta un gráfico de 1994 y 2016 de Czech Republic. Los datos de 1993 están ausentes. El número de observaciones reales por fecha: 23.

Fuente (nombre):

Indicadores del desarrollo mundial

Fuente (organización):

International Monetary Fund, Balance of Payments Statistics Yearbook and data files.

Categorías:

Economy & Growth, Trade

Se ha actualizado:

23 abr 2017 año

Los indicadores de los cambios de valor en los últimos años

En promedio:
67.423 bn
Mínimo:
13.352 bn
1 ene 1994 año
Máximo:
135.923 bn
1 ene 2015 año
A la fecha de observación
Valor
Cambio absoluto
El cambio con respecto al valor anterior
1 ene 1994 año
13.352 bn
+13.352 bn
0.0%
1 ene 1995 año
14.866 bn
+1.514 bn
11.34%
1 ene 1996 año
20.841 bn
+5.976 bn
40.2%
1 ene 1997 año
22.832 bn
+1.991 bn
9.55%
1 ene 1998 año
22.251 bn
-580.693 millones
-2.54%
1 ene 1999 año
22.818 bn
+566.939 millones
2.55%
1 ene 2000 año
22.488 bn
-330.408 millones
-1.45%
1 ene 2001 año
25.544 bn
+3.056 bn
13.59%
1 ene 2002 año
28.788 bn
+3.244 bn
12.7%
1 ene 2003 año
32.343 bn
+3.555 bn
12.35%
1 ene 2004 año
41.289 bn
+8.946 bn
27.66%
1 ene 2005 año
59.243 bn
+17.954 bn
43.48%
1 ene 2006 año
63.7 bn
+4.457 bn
7.52%
1 ene 2007 año
77.047 bn
+13.347 bn
20.95%
1 ene 2008 año
98.005 bn
+20.958 bn
27.2%
1 ene 2009 año
126.415 bn
+28.41 bn
28.99%
1 ene 2010 año
97.66 bn
-28.755 bn
-22.75%
1 ene 2011 año
112.974 bn
+15.314 bn
15.68%
1 ene 2012 año
133.616 bn
+20.642 bn
18.27%
1 ene 2013 año
127.786 bn
-5.83 bn
-4.36%
1 ene 2014 año
128.469 bn
+682.516 millones
0.53%
1 ene 2015 año
135.923 bn
+7.455 bn
5.8%
1 ene 2016 año
122.484 bn
-13.44 bn
-9.89%

Ranking de los países por los datos estadísticos actuales