29
/es/
es
AIzaSyAYiBZKx7MnpbEhh9jyipgxe19OcubqV5w
April 1, 2024
114839
Croatia
HRV
true
2
1
Goods imports (BoP, current US$)
2016,2015,2014,2013,2012,2011,2010,2009,2008,2007,2006,2005,2004,2003,2002,2001,2000,1999,1998,1997,1996,1995,1994
Download
Estadísticas Globales de la Biblioteca →Croatia →

Goods imports (BoP, current US$)

Estas estadísticas en otros países:
AfghanistanAlbaniaAlgeriaAngolaAntigua and BarbudaArab WorldArgentinaArmeniaArubaAustraliaAustriaAzerbaijanBahamas, TheBahrainBangladeshBarbadosBelarusBelgiumBelizeBeninBermudaBhutanBoliviaBosnia and HerzegovinaBotswanaBrazilBrunei DarussalamBulgariaBurkina FasoBurundiCabo VerdeCambodiaCameroonCanadaCaribbean small statesCentral African RepublicCentral Europe and the BalticsChadChileChinaColombiaComorosCongo, Dem. Rep.Congo, Rep.Costa RicaCote d'IvoireCroatiaCuracaoCyprusCzech RepublicDenmarkDjiboutiDominicaDominican RepublicEarly-demographic dividendEast Asia & PacificEast Asia & Pacific (excluding high income)East Asia & Pacific (IDA & IBRD countries)EcuadorEgypt, Arab Rep.El SalvadorEquatorial GuineaEritreaEstoniaEthiopiaEuro areaEurope & Central AsiaEurope & Central Asia (excluding high income)Europe & Central Asia (IDA & IBRD countries)European UnionFaroe IslandsFijiFinlandFragile and conflict affected situationsFranceFrench PolynesiaGabonGambia, TheGeorgiaGermanyGhanaGreeceGrenadaGuatemalaGuineaGuinea-BissauGuyanaHaitiHeavily indebted poor countries (HIPC)High incomeHondurasHong Kong SAR, ChinaHungaryIBRD onlyIcelandIDA & IBRD totalIDA blendIDA onlyIDA totalIndiaIndonesiaIran, Islamic Rep.IraqIrelandIsraelItalyJamaicaJapanJordanKazakhstanKenyaKiribatiKorea, Rep.KosovoKuwaitKyrgyz RepublicLao PDRLate-demographic dividendLatin America & Caribbean Latin America & Caribbean (excluding high income)Latin America & the Caribbean (IDA & IBRD countries)LatviaLeast developed countries: UN classificationLebanonLesothoLiberiaLibyaLithuaniaLow & middle incomeLow incomeLower middle incomeLuxembourgMacao SAR, ChinaMacedonia, FYRMadagascarMalawiMalaysiaMaldivesMaliMaltaMarshall IslandsMauritaniaMauritiusMexicoMicronesia, Fed. Sts.Middle East & North Africa (excluding high income)Middle East & North Africa (IDA & IBRD countries)Middle incomeMoldovaMongoliaMontenegroMoroccoMozambiqueMyanmarNamibiaNepalNetherlandsNew CaledoniaNew ZealandNicaraguaNigerNigeriaNorth AmericaNorwayOECD membersOmanOther small statesPacific island small statesPakistanPalauPanamaPapua New GuineaParaguayPeruPhilippinesPolandPortugalPost-demographic dividendPre-demographic dividendQatarRomaniaRussian FederationRwandaSamoaSao Tome and PrincipeSaudi ArabiaSenegalSerbiaSeychellesSierra LeoneSingaporeSint Maarten (Dutch part)Slovak RepublicSloveniaSmall statesSolomon IslandsSouth AfricaSouth AsiaSouth Asia (IDA & IBRD)South SudanSpainSri LankaSt. Kitts and NevisSt. LuciaSt. Vincent and the GrenadinesSub-Saharan Africa Sub-Saharan Africa (excluding high income)Sub-Saharan Africa (IDA & IBRD countries)SudanSurinameSwazilandSwedenSwitzerlandSyrian Arab RepublicTajikistanTanzaniaThailandTimor-LesteTogoTongaTrinidad and TobagoTunisiaTurkeyTuvaluUgandaUkraineUnited KingdomUnited StatesUpper middle incomeUruguayVanuatuVenezuela, RBVietnamWest Bank and GazaWorldYemen, Rep.ZambiaZimbabwe
línea de tiempo (timeline):
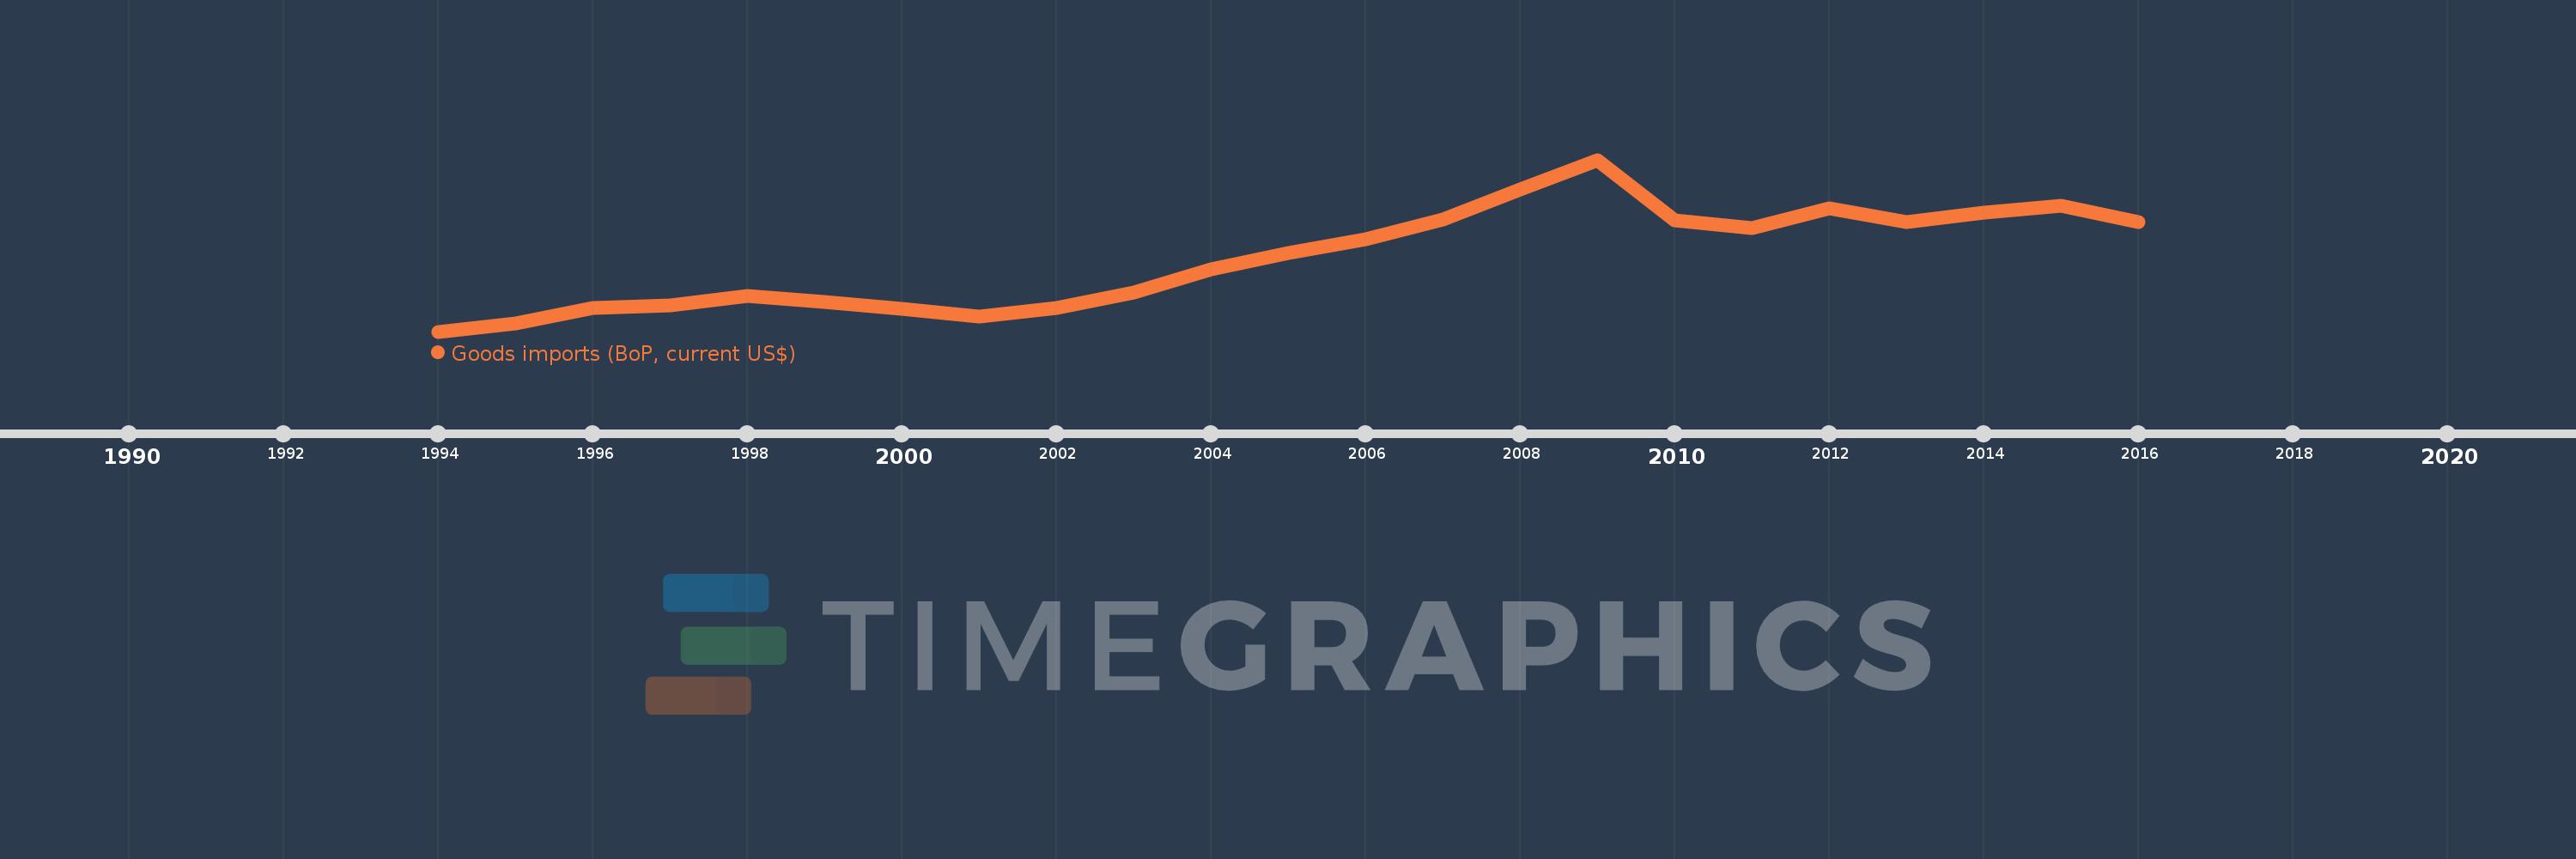
En esta escala de tiempo se presenta un gráfico de 1994 y 2016 de Croatia. Los datos de 1993 están ausentes. El número de observaciones reales por fecha: 23.
Fuente (nombre):
Indicadores del desarrollo mundial
Fuente (organización):
International Monetary Fund, Balance of Payments Statistics Yearbook and data files.
Categorías:
Economy & Growth, Trade
Se ha actualizado:
23 abr 2017 año
Los indicadores de los cambios de valor en los últimos años
En promedio:
14.431 bn
Mínimo:
4.62 bn
1 ene 1994 año
Máximo:
27.619 bn
1 ene 2009 año
A la fecha de observación
Valor
Cambio absoluto
El cambio con respecto al valor anterior
1 ene 1994 año
4.62 bn
+4.62 bn
0.0%
1 ene 1995 año
5.681 bn
+1.062 bn
22.98%
1 ene 1996 año
7.745 bn
+2.064 bn
36.32%
1 ene 1997 año
8.147 bn
+402.145 millones
5.19%
1 ene 1998 año
9.384 bn
+1.237 bn
15.19%
1 ene 1999 año
8.625 bn
-759.11 millones
-8.09%
1 ene 2000 año
7.674 bn
-951.486 millones
-11.03%
1 ene 2001 año
6.632 bn
-1.041 bn
-13.57%
1 ene 2002 año
7.772 bn
+1.139 bn
17.18%
1 ene 2003 año
9.85 bn
+2.078 bn
26.74%
1 ene 2004 año
12.957 bn
+3.107 bn
31.54%
1 ene 2005 año
15.197 bn
+2.24 bn
17.29%
1 ene 2006 año
17.024 bn
+1.827 bn
12.02%
1 ene 2007 año
19.636 bn
+2.612 bn
15.35%
1 ene 2008 año
23.668 bn
+4.031 bn
20.53%
1 ene 2009 año
27.619 bn
+3.951 bn
16.69%
1 ene 2010 año
19.557 bn
-8.062 bn
-29.19%
1 ene 2011 año
18.522 bn
-1.035 bn
-5.29%
1 ene 2012 año
21.077 bn
+2.554 bn
13.79%
1 ene 2013 año
19.233 bn
-1.844 bn
-8.75%
1 ene 2014 año
20.572 bn
+1.339 bn
6.96%
1 ene 2015 año
21.434 bn
+862.346 millones
4.19%
1 ene 2016 año
19.282 bn
-2.152 bn
-10.04%
Ranking de los países por los datos estadísticos actuales

Comentarios:

Enviar
PremiumAbout & FeedbackAcuerdoPrivacidad
logo
© 2022 Selected Technologies LLC – Morgan Hill, California