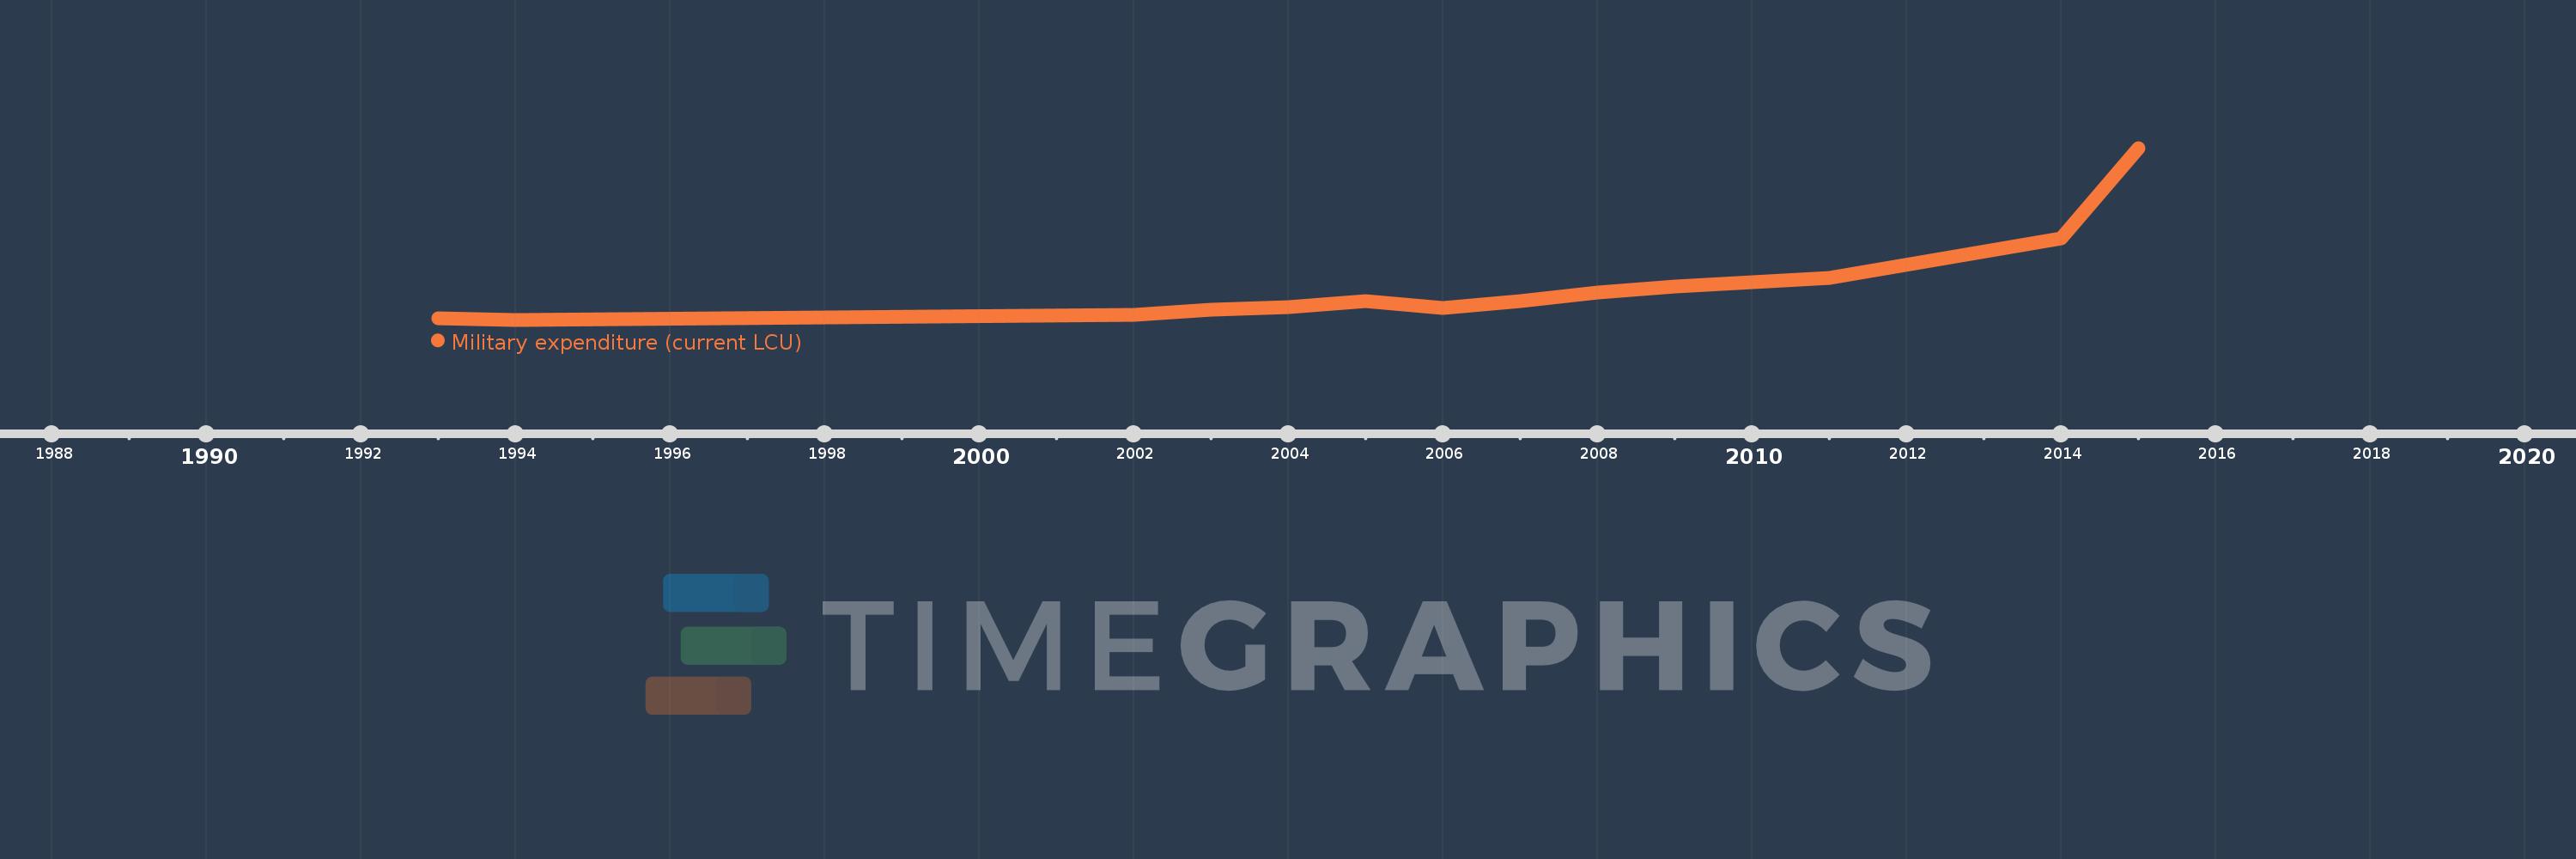
En esta escala de tiempo se presenta un gráfico de 1993 y 2015 de Congo, Rep.. Los datos de 1992 están ausentes. El número de observaciones reales por fecha: 13.
Fuente (nombre):
Indicadores del desarrollo mundial
Fuente (organización):
Stockholm International Peace Research Institute (SIPRI), Yearbook: Armaments, Disarmament and International Security.
Categorías:
Public Sector
Se ha actualizado:
23 abr 2017 año
Los indicadores de los cambios de valor en los últimos años
En promedio:
92.662 bn
Mínimo:
31.0 bn
1 ene 1994 año
Máximo:
348.51 bn
1 ene 2015 año
A la fecha de observación
Valor
Cambio absoluto
El cambio con respecto al valor anterior
1 ene 1993 año
33.25 bn
+33.25 bn
0.0%
1 ene 1994 año
31.0 bn
-2.25 bn
-6.77%
1 ene 2002 año
39.911 bn
+8.911 bn
28.75%
1 ene 2003 año
49.28 bn
+9.369 bn
23.47%
1 ene 2004 año
54.503 bn
+5.223 bn
10.6%
1 ene 2005 año
65.665 bn
+11.162 bn
20.48%
1 ene 2006 año
53.23 bn
-12.435 bn
-18.94%
1 ene 2007 año
66.182 bn
+12.952 bn
24.33%
1 ene 2008 año
80.555 bn
+14.373 bn
21.72%
1 ene 2009 año
93.02 bn
+12.465 bn
15.47%
1 ene 2011 año
108.164 bn
+15.144 bn
16.28%
1 ene 2014 año
181.341 bn
+73.177 bn
67.65%
1 ene 2015 año
348.51 bn
+167.169 bn
92.18%
Ranking de los países por los datos estadísticos actuales