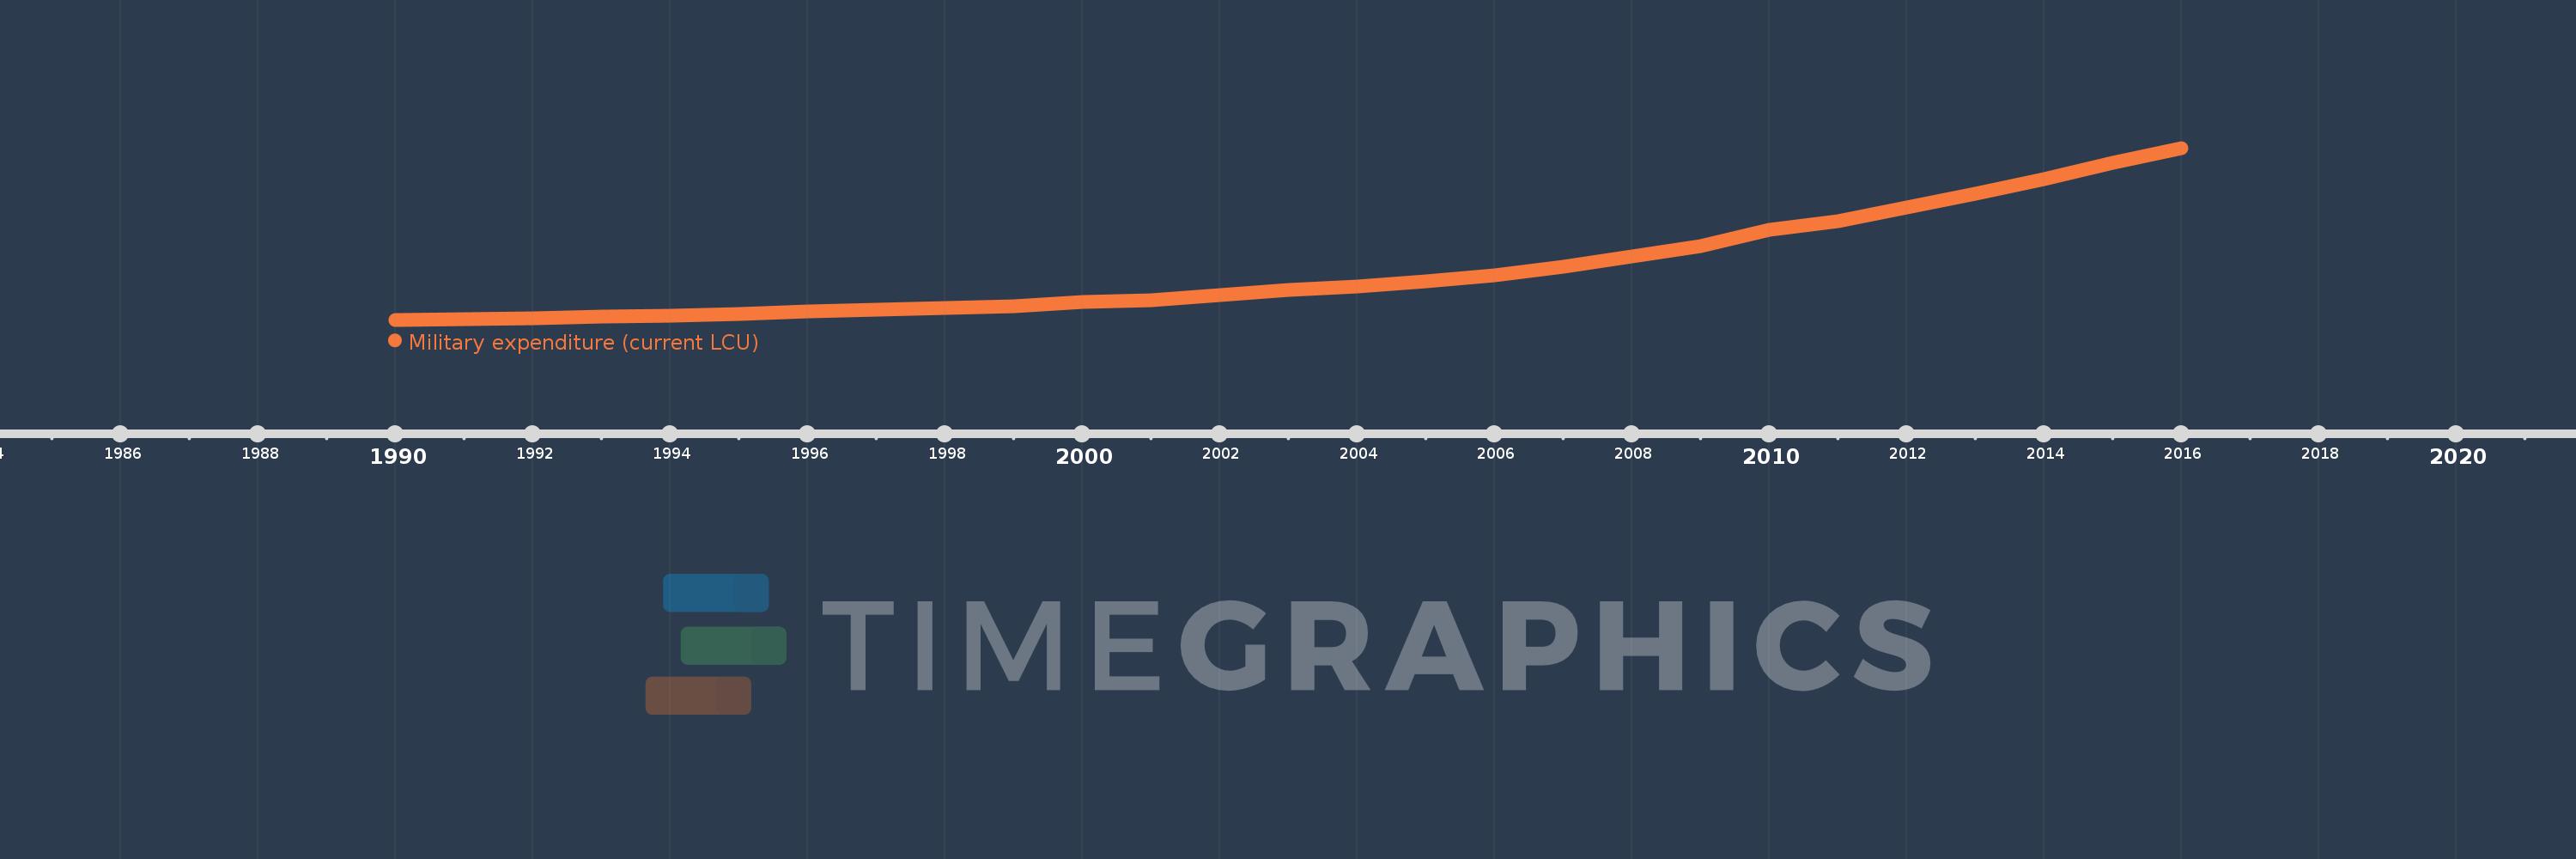
En esta escala de tiempo se presenta un gráfico de 1990 y 2016 de China. Los datos de 1989 están ausentes. El número de observaciones reales por fecha: 27.
Fuente (nombre):
Indicadores del desarrollo mundial
Fuente (organización):
Stockholm International Peace Research Institute (SIPRI), Yearbook: Armaments, Disarmament and International Security.
Categorías:
Public Sector
Se ha actualizado:
23 abr 2017 año
Los indicadores de los cambios de valor en los últimos años
En promedio:
420.468 bn
Mínimo:
42.935 bn
1 ene 1990 año
Máximo:
1.337 billones
1 ene 2016 año
A la fecha de observación
Valor
Cambio absoluto
El cambio con respecto al valor anterior
1 ene 1990 año
42.935 bn
+42.935 bn
0.0%
1 ene 1991 año
48.239 bn
+5.304 bn
12.35%
1 ene 1992 año
52.987 bn
+4.748 bn
9.84%
1 ene 1993 año
68.493 bn
+15.506 bn
29.26%
1 ene 1994 año
72.469 bn
+3.976 bn
5.81%
1 ene 1995 año
86.623 bn
+14.154 bn
19.53%
1 ene 1996 año
105.28 bn
+18.657 bn
21.54%
1 ene 1997 año
121.081 bn
+15.801 bn
15.01%
1 ene 1998 año
133.507 bn
+12.425 bn
10.26%
1 ene 1999 año
145.114 bn
+11.607 bn
8.69%
1 ene 2000 año
174.07 bn
+28.956 bn
19.95%
1 ene 2001 año
189.824 bn
+15.754 bn
9.05%
1 ene 2002 año
230.727 bn
+40.902 bn
21.55%
1 ene 2003 año
266.003 bn
+35.276 bn
15.29%
1 ene 2004 año
290.742 bn
+24.739 bn
9.3%
1 ene 2005 año
333.991 bn
+43.249 bn
14.88%
1 ene 2006 año
374.717 bn
+40.726 bn
12.19%
1 ene 2007 año
441.23 bn
+66.513 bn
17.75%
1 ene 2008 año
517.997 bn
+76.767 bn
17.4%
1 ene 2009 año
600.45 bn
+82.453 bn
15.92%
1 ene 2010 año
721.628 bn
+121.178 bn
20.18%
1 ene 2011 año
783.324 bn
+61.696 bn
8.55%
1 ene 2012 año
891.47 bn
+108.146 bn
13.81%
1 ene 2013 año
993.85 bn
+102.379 bn
11.48%
1 ene 2014 año
1.102 billones
+108.055 bn
10.87%
1 ene 2015 año
1.227 billones
+124.64 bn
11.31%
1 ene 2016 año
1.337 billones
+110.891 bn
9.04%
Ranking de los países por los datos estadísticos actuales