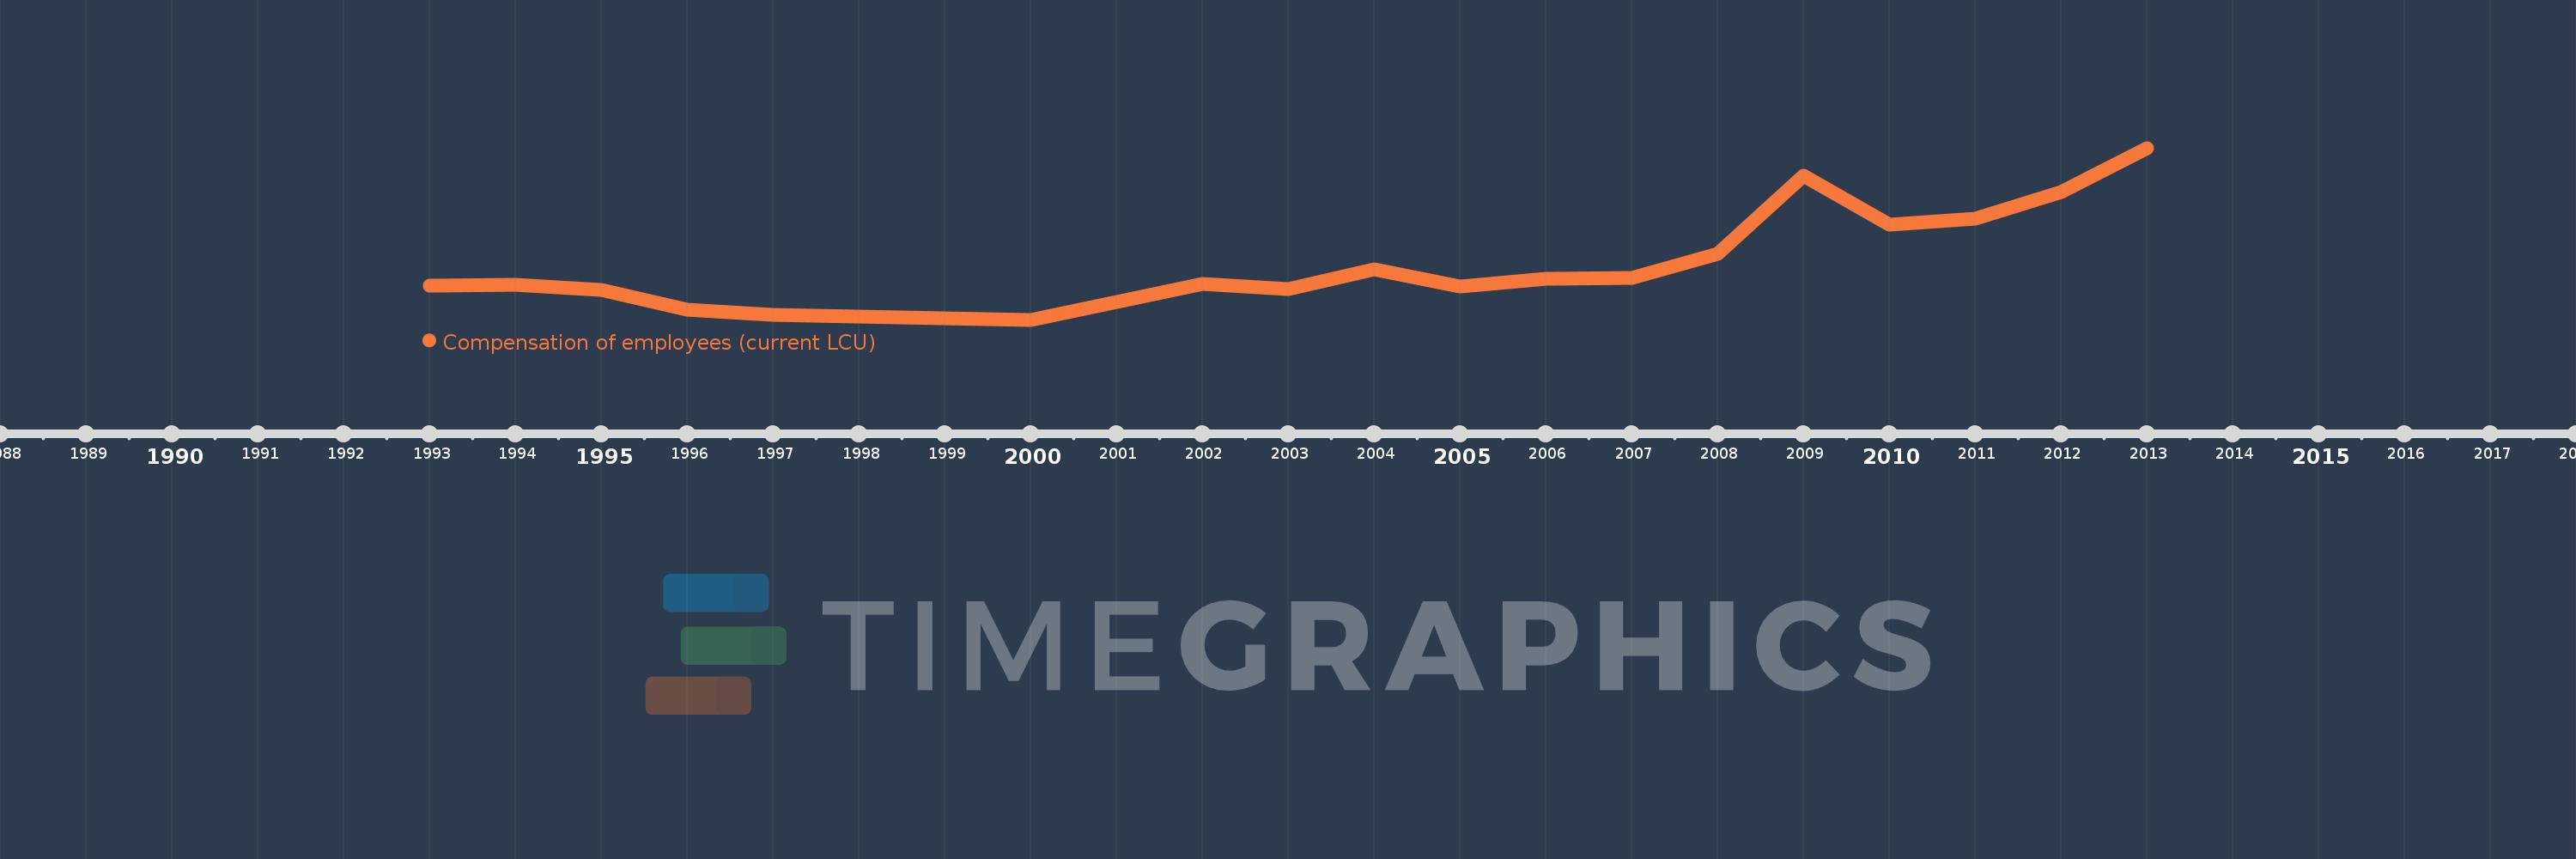
En esta escala de tiempo se presenta un gráfico de 1993 y 2013 de Congo, Rep.. Los datos de 1992 están ausentes. El número de observaciones reales por fecha: 20.
Fuente (nombre):
Indicadores del desarrollo mundial
Fuente (organización):
International Monetary Fund, Government Finance Statistics Yearbook and data files.
Categorías:
Public Sector
Se ha actualizado:
23 abr 2017 año
Los indicadores de los cambios de valor en los últimos años
En promedio:
154.605 bn
Mínimo:
100.7 bn
1 ene 2000 año
Máximo:
275.627 bn
1 ene 2013 año
A la fecha de observación
Valor
Cambio absoluto
El cambio con respecto al valor anterior
1 ene 1993 año
135.0 bn
+135.0 bn
0.0%
1 ene 1994 año
136.2 bn
+1.2 bn
0.89%
1 ene 1995 año
130.8 bn
-5.4 bn
-3.96%
1 ene 1996 año
111.1 bn
-19.7 bn
-15.06%
1 ene 1997 año
106.0 bn
-5.1 bn
-4.59%
1 ene 1998 año
104.2 bn
-1.8 bn
-1.7%
1 ene 1999 año
102.4 bn
-1.8 bn
-1.73%
1 ene 2000 año
100.7 bn
-1.7 bn
-1.66%
1 ene 2002 año
137.57 bn
+36.87 bn
36.61%
1 ene 2003 año
131.8 bn
-5.769 bn
-4.19%
1 ene 2004 año
152.09 bn
+20.29 bn
15.39%
1 ene 2005 año
134.841 bn
-17.249 bn
-11.34%
1 ene 2006 año
142.646 bn
+7.805 bn
5.79%
1 ene 2007 año
143.7 bn
+1.054 bn
0.74%
1 ene 2008 año
168.049 bn
+24.349 bn
16.94%
1 ene 2009 año
247.727 bn
+79.678 bn
47.41%
1 ene 2010 año
197.747 bn
-49.98 bn
-20.18%
1 ene 2011 año
203.537 bn
+5.79 bn
2.93%
1 ene 2012 año
230.36 bn
+26.823 bn
13.18%
1 ene 2013 año
275.627 bn
+45.267 bn
19.65%
Ranking de los países por los datos estadísticos actuales