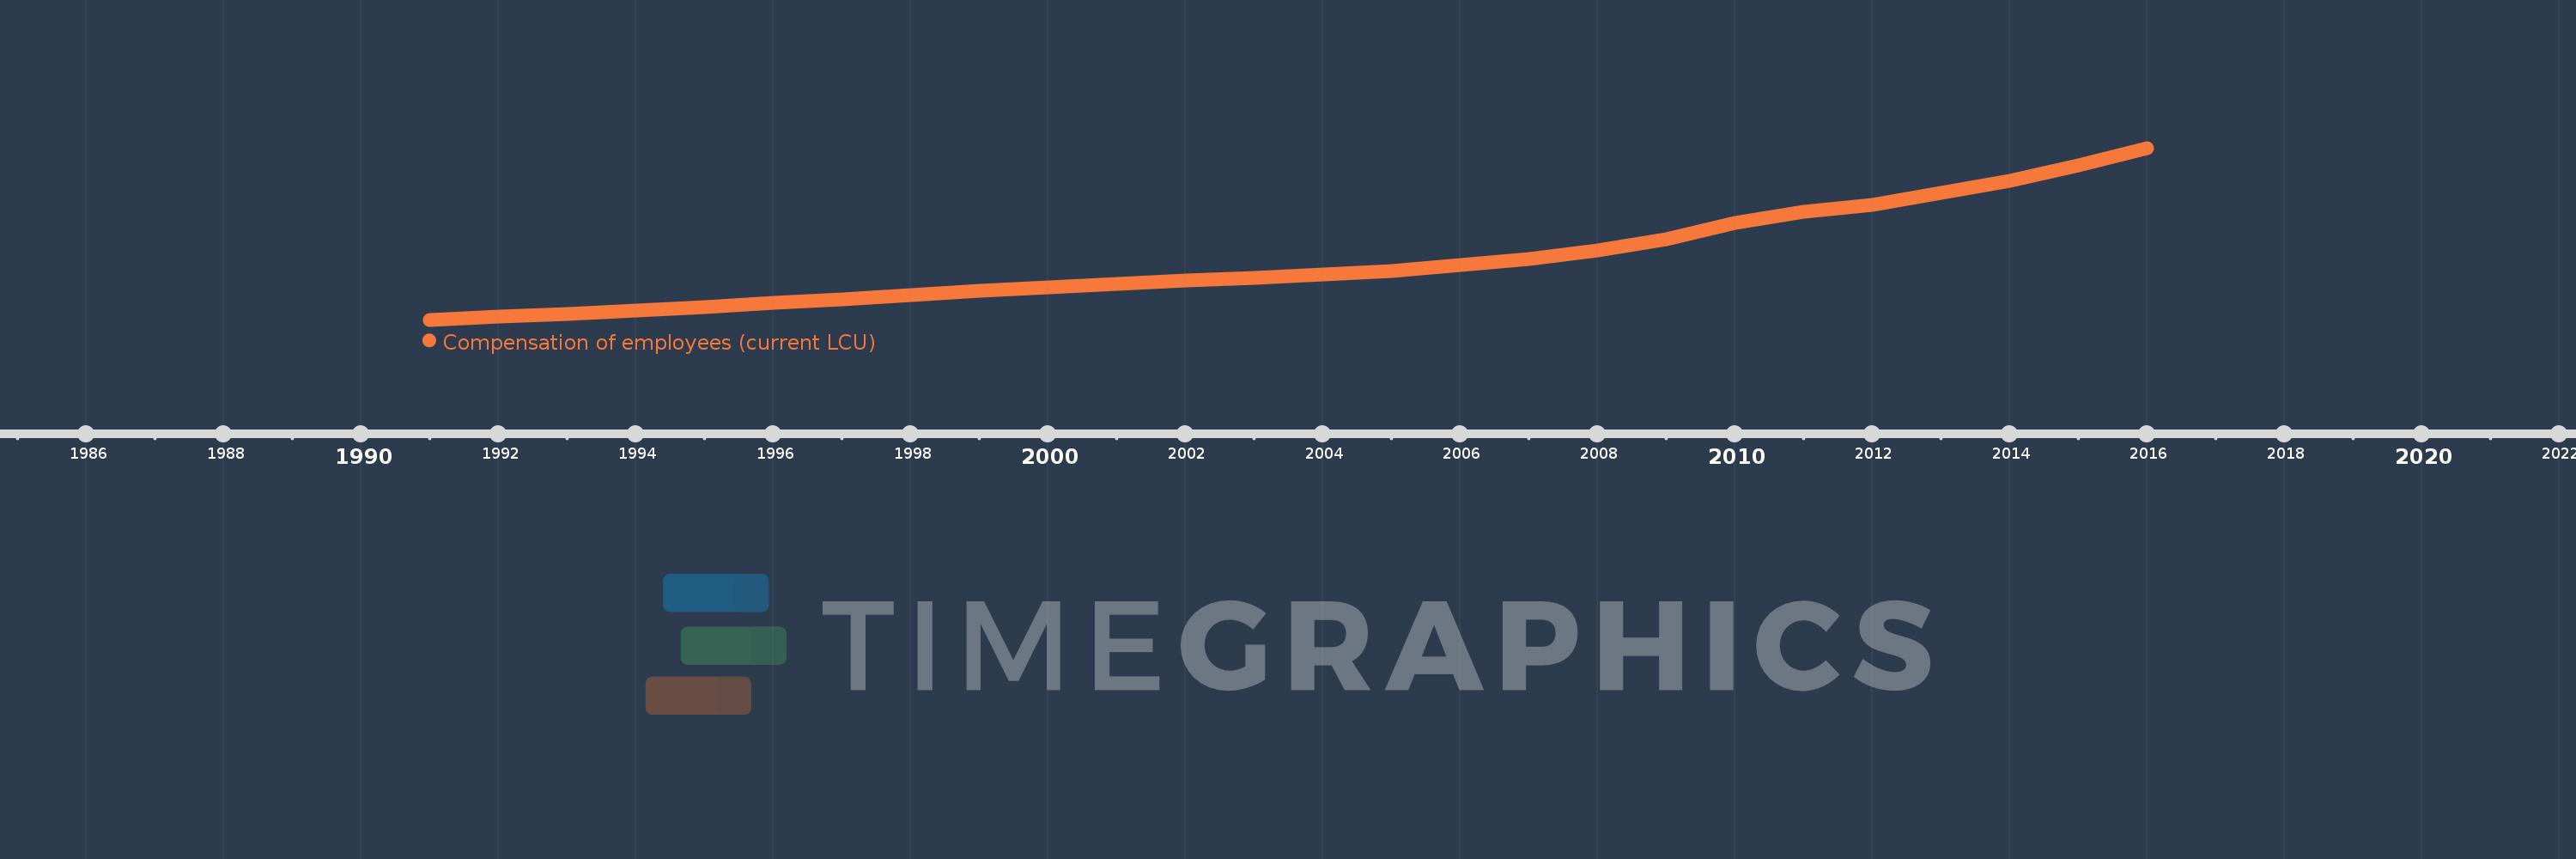
En esta escala de tiempo se presenta un gráfico de 1991 y 2016 de Chile. Los datos de 1990 están ausentes. El número de observaciones reales por fecha: 26.
Fuente (nombre):
Indicadores del desarrollo mundial
Fuente (organización):
International Monetary Fund, Government Finance Statistics Yearbook and data files.
Categorías:
Public Sector
Se ha actualizado:
23 abr 2017 año
Los indicadores de los cambios de valor en los últimos años
En promedio:
2.709 billones
Mínimo:
336.25 bn
1 ene 1991 año
Máximo:
7.209 billones
1 ene 2016 año
A la fecha de observación
Valor
Cambio absoluto
El cambio con respecto al valor anterior
1 ene 1991 año
336.25 bn
+336.25 bn
0.0%
1 ene 1992 año
449.19 bn
+112.94 bn
33.59%
1 ene 1993 año
570.55 bn
+121.36 bn
27.02%
1 ene 1994 año
713.29 bn
+142.74 bn
25.02%
1 ene 1995 año
854.24 bn
+140.95 bn
19.76%
1 ene 1996 año
1.0 billones
+146.01 bn
17.09%
1 ene 1997 año
1.159 billones
+159.04 bn
15.9%
1 ene 1998 año
1.325 billones
+165.67 bn
14.29%
1 ene 1999 año
1.491 billones
+166.02 bn
12.53%
1 ene 2000 año
1.645 billones
+154.37 bn
10.35%
1 ene 2001 año
1.778 billones
+133.14 bn
8.09%
1 ene 2002 año
1.892 billones
+113.46 bn
6.38%
1 ene 2003 año
2.011 billones
+119.34 bn
6.31%
1 ene 2004 año
2.131 billones
+119.31 bn
5.93%
1 ene 2005 año
2.302 billones
+170.98 bn
8.02%
1 ene 2006 año
2.518 billones
+216.42 bn
9.4%
1 ene 2007 año
2.76 billones
+242.0 bn
9.61%
1 ene 2008 año
3.108 billones
+347.938 bn
12.61%
1 ene 2009 año
3.545 billones
+436.952 bn
14.06%
1 ene 2010 año
4.21 billones
+665.521 bn
18.77%
1 ene 2011 año
4.66 billones
+449.288 bn
10.67%
1 ene 2012 año
4.947 billones
+287.211 bn
6.16%
1 ene 2013 año
5.41 billones
+462.756 bn
9.35%
1 ene 2014 año
5.894 billones
+484.574 bn
8.96%
1 ene 2015 año
6.511 billones
+616.716 bn
10.46%
1 ene 2016 año
7.209 billones
+697.813 bn
10.72%
Ranking de los países por los datos estadísticos actuales