33
/de/
AIzaSyAYiBZKx7MnpbEhh9jyipgxe19OcubqV5w
August 1, 2025
97686
Cabo Verde
CPV
true
2
1
Net intake rate in grade 1, male (% of official school-age population)
2015,2014,2012,2011,2010,2009,2008,2007,2006,2005,2004,2003,2001
Download
Bibliothek der Globalstatistik →Cabo Verde →

Net intake rate in grade 1, male (% of official school-age population)

Diese Statistik in anderen Ländern:

AfghanistanAlbaniaAlgeriaAngolaAntigua and BarbudaArab WorldArmeniaArubaAzerbaijanBahamas, TheBahrainBangladeshBarbadosBelarusBelizeBeninBermudaBhutanBoliviaBosnia and HerzegovinaBotswanaBrunei DarussalamBulgariaBurkina FasoBurundiCabo VerdeCambodiaCameroonCaribbean small statesCentral African RepublicChadChileColombiaComorosCongo, Dem. Rep.Congo, Rep.Costa RicaCote d'IvoireCroatiaCubaCyprusDenmarkDjiboutiDominicaDominican RepublicEarly-demographic dividendEcuadorEgypt, Arab Rep.El SalvadorEquatorial GuineaEritreaEstoniaEthiopiaEuro areaEurope & Central AsiaEurope & Central Asia (excluding high income)Europe & Central Asia (IDA & IBRD countries)FijiFragile and conflict affected situationsGambia, TheGeorgiaGhanaGreeceGrenadaGuatemalaGuineaGuinea-BissauGuyanaHeavily indebted poor countries (HIPC)High incomeHondurasIcelandIDA & IBRD totalIDA onlyIDA totalIndonesiaIran, Islamic Rep.IraqIrelandItalyJapanJordanKazakhstanKenyaKorea, Dem. People’s Rep.Korea, Rep.KuwaitKyrgyz RepublicLao PDRLatin America & Caribbean Latin America & Caribbean (excluding high income)Latin America & the Caribbean (IDA & IBRD countries)Least developed countries: UN classificationLebanonLesothoLiberiaLiechtensteinLithuaniaLow & middle incomeLow incomeLuxembourgMacedonia, FYRMadagascarMalawiMaldivesMaliMaltaMarshall IslandsMauritaniaMauritiusMexicoMicronesia, Fed. Sts.Middle East & North AfricaMiddle East & North Africa (excluding high income)Middle East & North Africa (IDA & IBRD countries)MoldovaMongoliaMontenegroMoroccoMozambiqueNamibiaNauruNepalNicaraguaNigerNorth AmericaNorwayOECD membersOmanOther small statesPacific island small statesParaguayPeruPhilippinesPortugalPost-demographic dividendPre-demographic dividendPuerto RicoQatarRomaniaRwandaSamoaSan MarinoSao Tome and PrincipeSaudi ArabiaSenegalSerbiaSeychellesSierra LeoneSloveniaSmall statesSolomon IslandsSouth AfricaSpainSri LankaSt. Kitts and NevisSt. LuciaSt. Vincent and the GrenadinesSub-Saharan Africa Sub-Saharan Africa (excluding high income)Sub-Saharan Africa (IDA & IBRD countries)SurinameSwazilandSwedenSwitzerlandSyrian Arab RepublicTajikistanTanzaniaThailandTimor-LesteTogoTongaTrinidad and TobagoTunisiaTurkeyUgandaUkraineUnited Arab EmiratesUnited StatesUruguayUzbekistanVanuatuVenezuela, RBWest Bank and GazaWorldYemen, Rep.ZambiaZimbabwe

Zeitlinie:

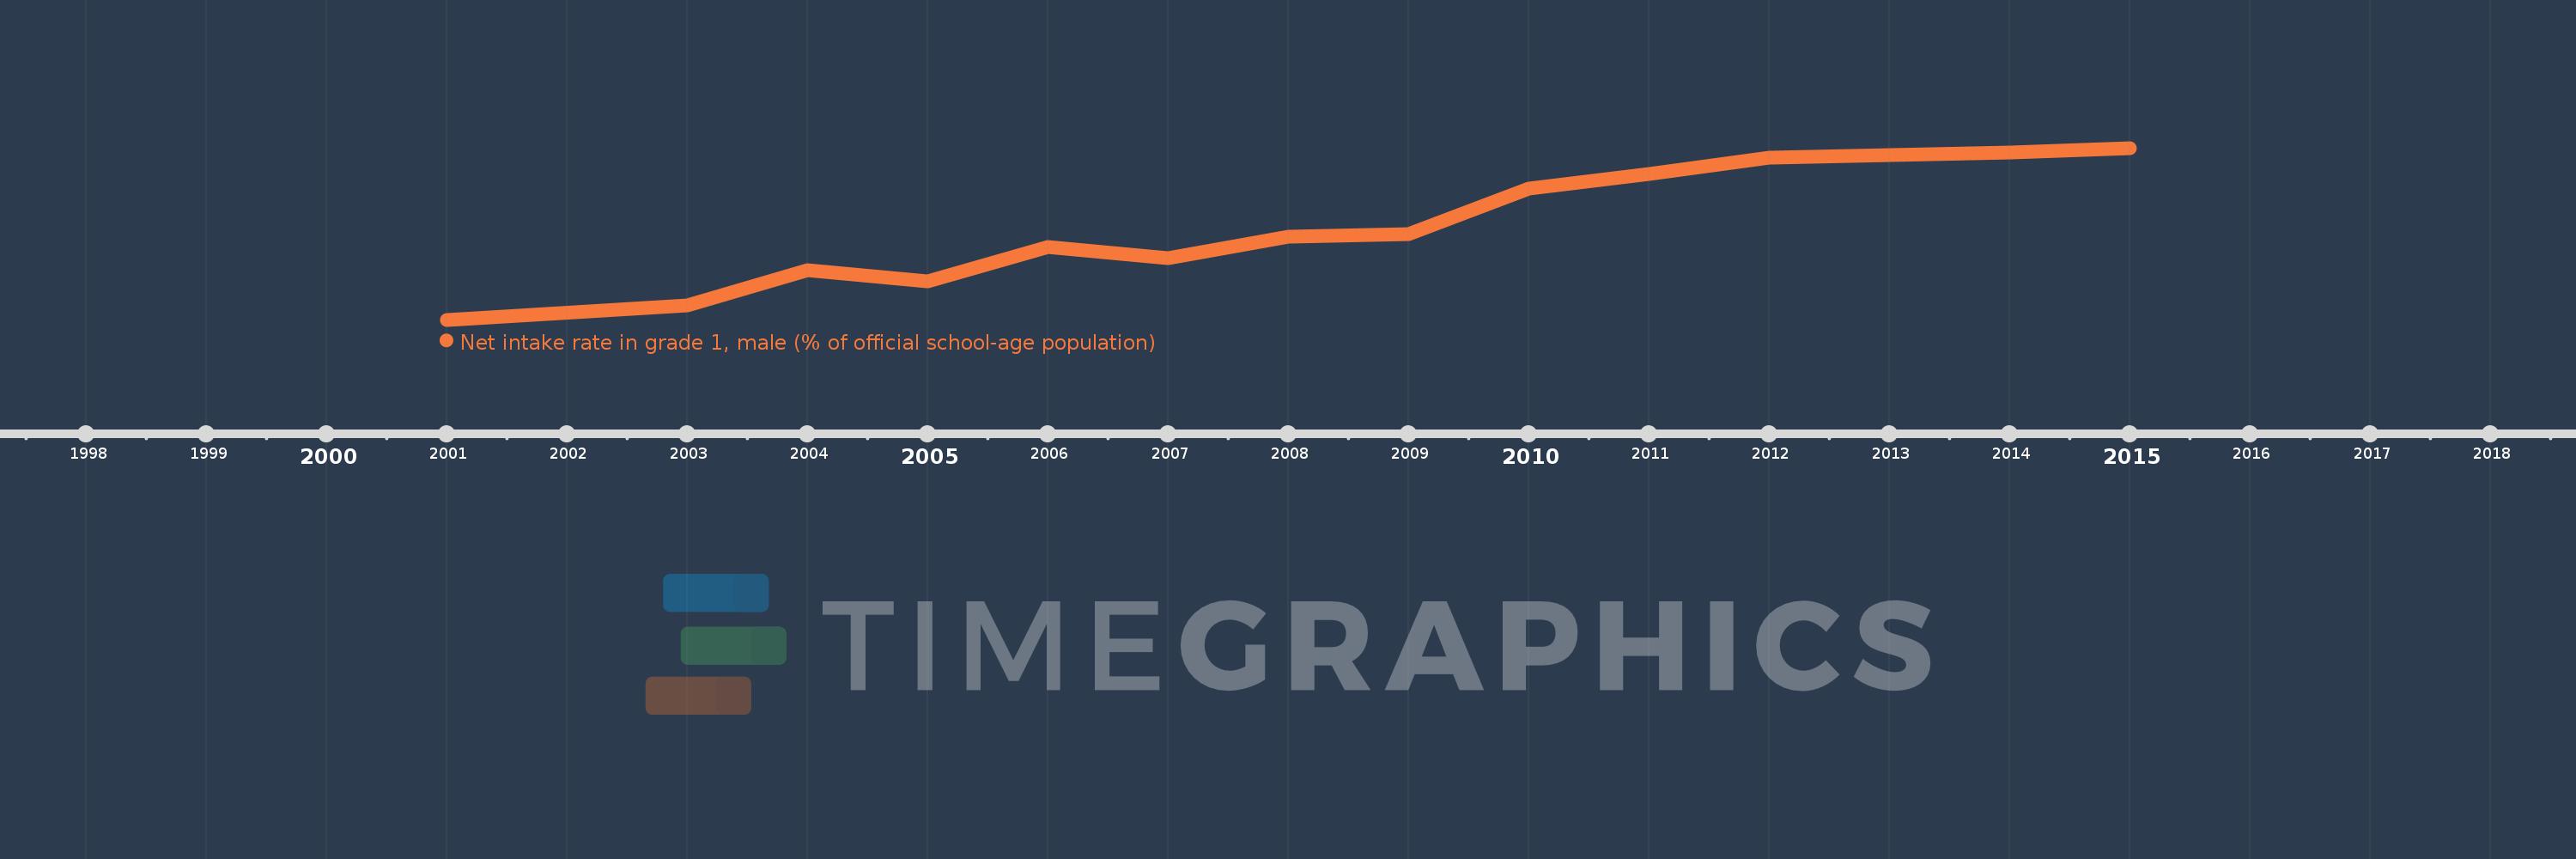
Diese Zeitleiste vorliegt die Graphik ab 2001 J. bis 2015 J. Cabo Verde. Die Angaben bis 2000 J. sind nicht vorhanden. Die Zahl aktueller Beobachtungen nach Daten: 13.

Die Quelle (Bezeichnung):

Kennzahlen der Weltentwicklung

Die Quelle (Einrichtung):

United Nations Educational, Scientific, and Cultural Organization (UNESCO) Institute for Statistics.

Kategorien:

Education, Gender

Es wurde aktualisiert:

23 Apr 2017 Jahr

Kennzahlen der Wertänderungen vom Jahr zum Jahr

im Durchschnitt:
82.359
Minimum:
63.017
1 Jan 2001 Jahr
Maximum:
99.489
1 Jan 2015 Jahr
Zum Datum der Beobachtung
Wert
Absolute Veränderung
Die Veränderung bezüglich dem vorherigen Wert
1 Jan 2001 Jahr
63.017
+63.017
0.0%
1 Jan 2003 Jahr
66.074
+3.057
4.85%
1 Jan 2004 Jahr
73.624
+7.549
11.43%
1 Jan 2005 Jahr
71.148
-2.476
-3.36%
1 Jan 2006 Jahr
78.513
+7.365
10.35%
1 Jan 2007 Jahr
76.144
-2.369
-3.02%
1 Jan 2008 Jahr
80.71
+4.566
6.0%
1 Jan 2009 Jahr
81.266
+0.556
0.69%
1 Jan 2010 Jahr
90.807
+9.541
11.74%
1 Jan 2011 Jahr
93.923
+3.116
3.43%
1 Jan 2012 Jahr
97.509
+3.586
3.82%
1 Jan 2014 Jahr
98.446
+0.937
0.96%
1 Jan 2015 Jahr
99.489
+1.042
1.06%

Bewertung der Länder gemäß mit laufender Statistik nach Jahren