29
/de/
de
AIzaSyAYiBZKx7MnpbEhh9jyipgxe19OcubqV5w
April 1, 2024
90123
Botswana
BWA
true
2
1
Net bilateral aid flows from DAC donors, Italy (current US$)
2005,2001,1998,1994,1991,1990,1989,1988,1987,1986,1985,1976,1975,1974,1973
Download
Bibliothek der Globalstatistik →Botswana →

Net bilateral aid flows from DAC donors, Italy (current US$)

Diese Statistik in anderen Ländern:
AfghanistanAlbaniaAlgeriaAngolaAntigua and BarbudaArab WorldArgentinaArmeniaAzerbaijanBahamas, TheBangladeshBarbadosBelarusBelizeBeninBhutanBoliviaBosnia and HerzegovinaBotswanaBrazilBulgariaBurkina FasoBurundiCabo VerdeCambodiaCameroonCaribbean small statesCentral African RepublicCentral Europe and the BalticsChadChileChinaColombiaComorosCongo, Dem. Rep.Congo, Rep.Costa RicaCote d'IvoireCroatiaCubaCyprusCzech RepublicDjiboutiDominicaDominican RepublicEast Asia & PacificEast Asia & Pacific (excluding high income)East Asia & Pacific (IDA & IBRD countries)EcuadorEgypt, Arab Rep.El SalvadorEquatorial GuineaEritreaEstoniaEthiopiaEuro areaEurope & Central AsiaEurope & Central Asia (excluding high income)Europe & Central Asia (IDA & IBRD countries)European UnionFijiFragile and conflict affected situationsGabonGambia, TheGeorgiaGhanaGuatemalaGuineaGuinea-BissauGuyanaHaitiHeavily indebted poor countries (HIPC)High incomeHondurasHong Kong SAR, ChinaHungaryIBRD onlyIDA & IBRD totalIDA blendIDA onlyIDA totalIndiaIndonesiaIran, Islamic Rep.IraqIsraelJamaicaJordanKazakhstanKenyaKiribatiKorea, Dem. People’s Rep.Korea, Rep.KosovoKuwaitKyrgyz RepublicLao PDRLatin America & Caribbean Latin America & Caribbean (excluding high income)Latin America & the Caribbean (IDA & IBRD countries)LatviaLeast developed countries: UN classificationLebanonLesothoLiberiaLibyaLithuaniaLow & middle incomeLow incomeLower middle incomeMacedonia, FYRMadagascarMalawiMalaysiaMaldivesMaliMaltaMarshall IslandsMauritaniaMauritiusMexicoMiddle East & North AfricaMiddle East & North Africa (excluding high income)Middle East & North Africa (IDA & IBRD countries)Middle incomeMoldovaMongoliaMontenegroMoroccoMozambiqueMyanmarNamibiaNauruNepalNicaraguaNigerNigeriaOECD membersOmanOther small statesPacific island small statesPakistanPalauPanamaPapua New GuineaParaguayPeruPhilippinesPolandRomaniaRussian FederationRwandaSamoaSao Tome and PrincipeSaudi ArabiaSenegalSerbiaSeychellesSierra LeoneSingaporeSlovak RepublicSloveniaSmall statesSolomon IslandsSomaliaSouth AfricaSouth AsiaSouth Asia (IDA & IBRD)South SudanSri LankaSt. Kitts and NevisSt. LuciaSt. Vincent and the GrenadinesSub-Saharan Africa Sub-Saharan Africa (excluding high income)Sub-Saharan Africa (IDA & IBRD countries)SudanSurinameSwazilandSyrian Arab RepublicTajikistanTanzaniaThailandTimor-LesteTogoTongaTrinidad and TobagoTunisiaTurkeyTurkmenistanTuvaluUgandaUkraineUnited Arab EmiratesUpper middle incomeUruguayUzbekistanVanuatuVenezuela, RBVietnamWest Bank and GazaWorldYemen, Rep.ZambiaZimbabwe
Zeitlinie:
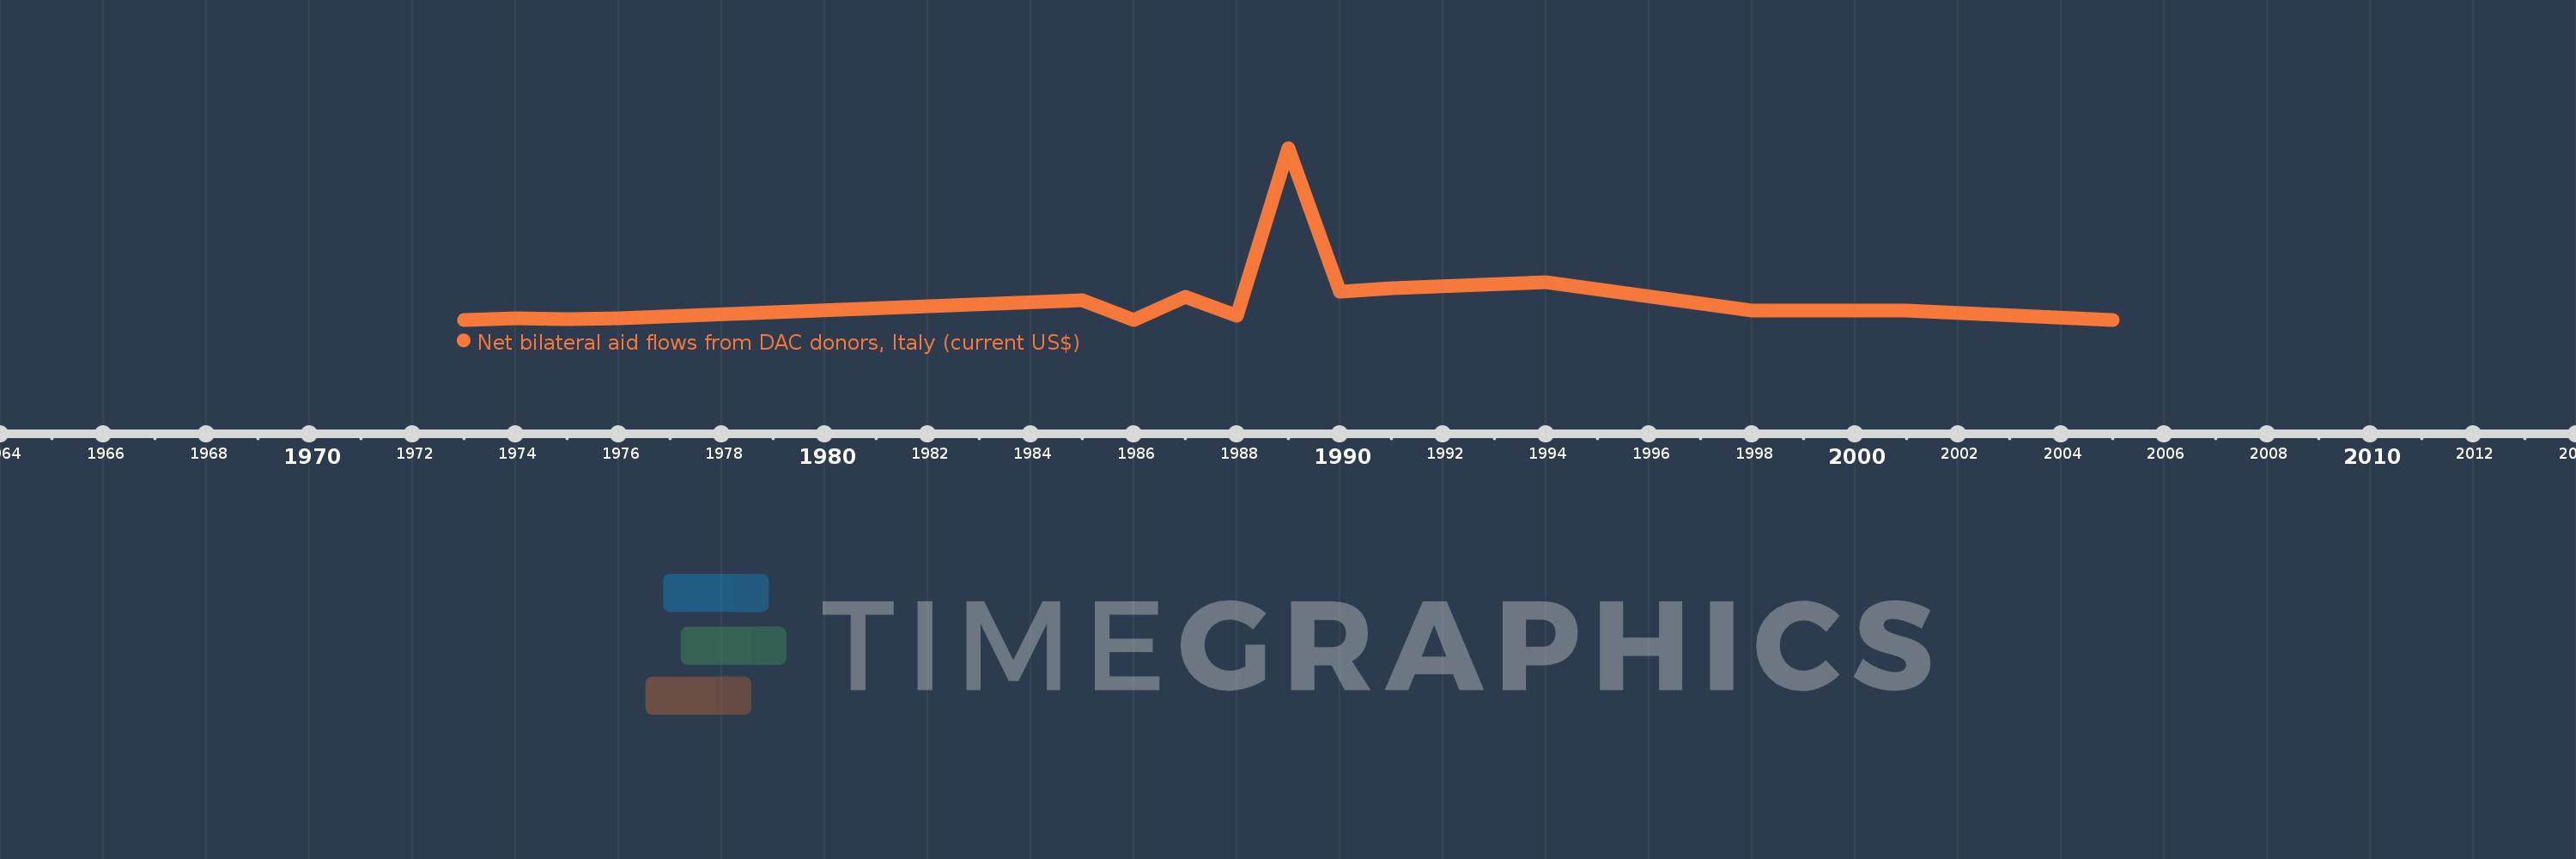
Diese Zeitleiste vorliegt die Graphik ab 1973 J. bis 2005 J. Botswana. Die Angaben bis 1972 J. sind nicht vorhanden. Die Zahl aktueller Beobachtungen nach Daten: 15.
Die Quelle (Bezeichnung):
Kennzahlen der Weltentwicklung
Die Quelle (Einrichtung):
Development Assistance Committee of the Organisation for Economic Co-operation and Development, Geographical Distribution of Financial Flows to Developing Countries, Development Co-operation Report, and International Development Statistics database. Data are available online at: www.oecd.org/dac/stats/idsonline.
Kategorien:
Aid Effectiveness
Es wurde aktualisiert:
23 Apr 2017 Jahr
Kennzahlen der Wertänderungen vom Jahr zum Jahr
im Durchschnitt:
252.667 Tsnd.
Minimum:
10.0 Tsnd.
1 Jan 1973 Jahr
Maximum:
1.86 Mln.
1 Jan 1989 Jahr
Zum Datum der Beobachtung
Wert
Absolute Veränderung
Die Veränderung bezüglich dem vorherigen Wert
1 Jan 1973 Jahr
10.0 Tsnd.
+10.0 Tsnd.
0.0%
1 Jan 1974 Jahr
30.0 Tsnd.
+20.0 Tsnd.
200.0%
1 Jan 1975 Jahr
20.0 Tsnd.
-10.0 Tsnd.
-33.33%
1 Jan 1976 Jahr
30.0 Tsnd.
+10.0 Tsnd.
50.0%
1 Jan 1985 Jahr
220.0 Tsnd.
+190.0 Tsnd.
633.33%
1 Jan 1986 Jahr
10.0 Tsnd.
-210.0 Tsnd.
-95.45%
1 Jan 1987 Jahr
260.0 Tsnd.
+250.0 Tsnd.
2.5 Tsnd.%
1 Jan 1988 Jahr
50.0 Tsnd.
-210.0 Tsnd.
-80.77%
1 Jan 1989 Jahr
1.86 Mln.
+1.81 Mln.
3.62 Tsnd.%
1 Jan 1990 Jahr
310.0 Tsnd.
-1.55 Mln.
-83.33%
1 Jan 1991 Jahr
350.0 Tsnd.
+40.0 Tsnd.
12.9%
1 Jan 1994 Jahr
410.0 Tsnd.
+60.0 Tsnd.
17.14%
1 Jan 1998 Jahr
110.0 Tsnd.
-300.0 Tsnd.
-73.17%
1 Jan 2001 Jahr
110.0 Tsnd.
0.0
0.0%
1 Jan 2005 Jahr
10.0 Tsnd.
-100.0 Tsnd.
-90.91%
Bewertung der Länder gemäß mit laufender Statistik nach Jahren

Kommentare:

Abschicken
PremiumAbout & FeedbackVereinbarungPrivatheit
logo
© 2022 Selected Technologies LLC – Morgan Hill, California