33
/de/
AIzaSyB4mHJ5NPEv-XzF7P6NDYXjlkCWaeKw5bc
November 30, 2025
234927
Saudi Arabia
SAU
true
2
1
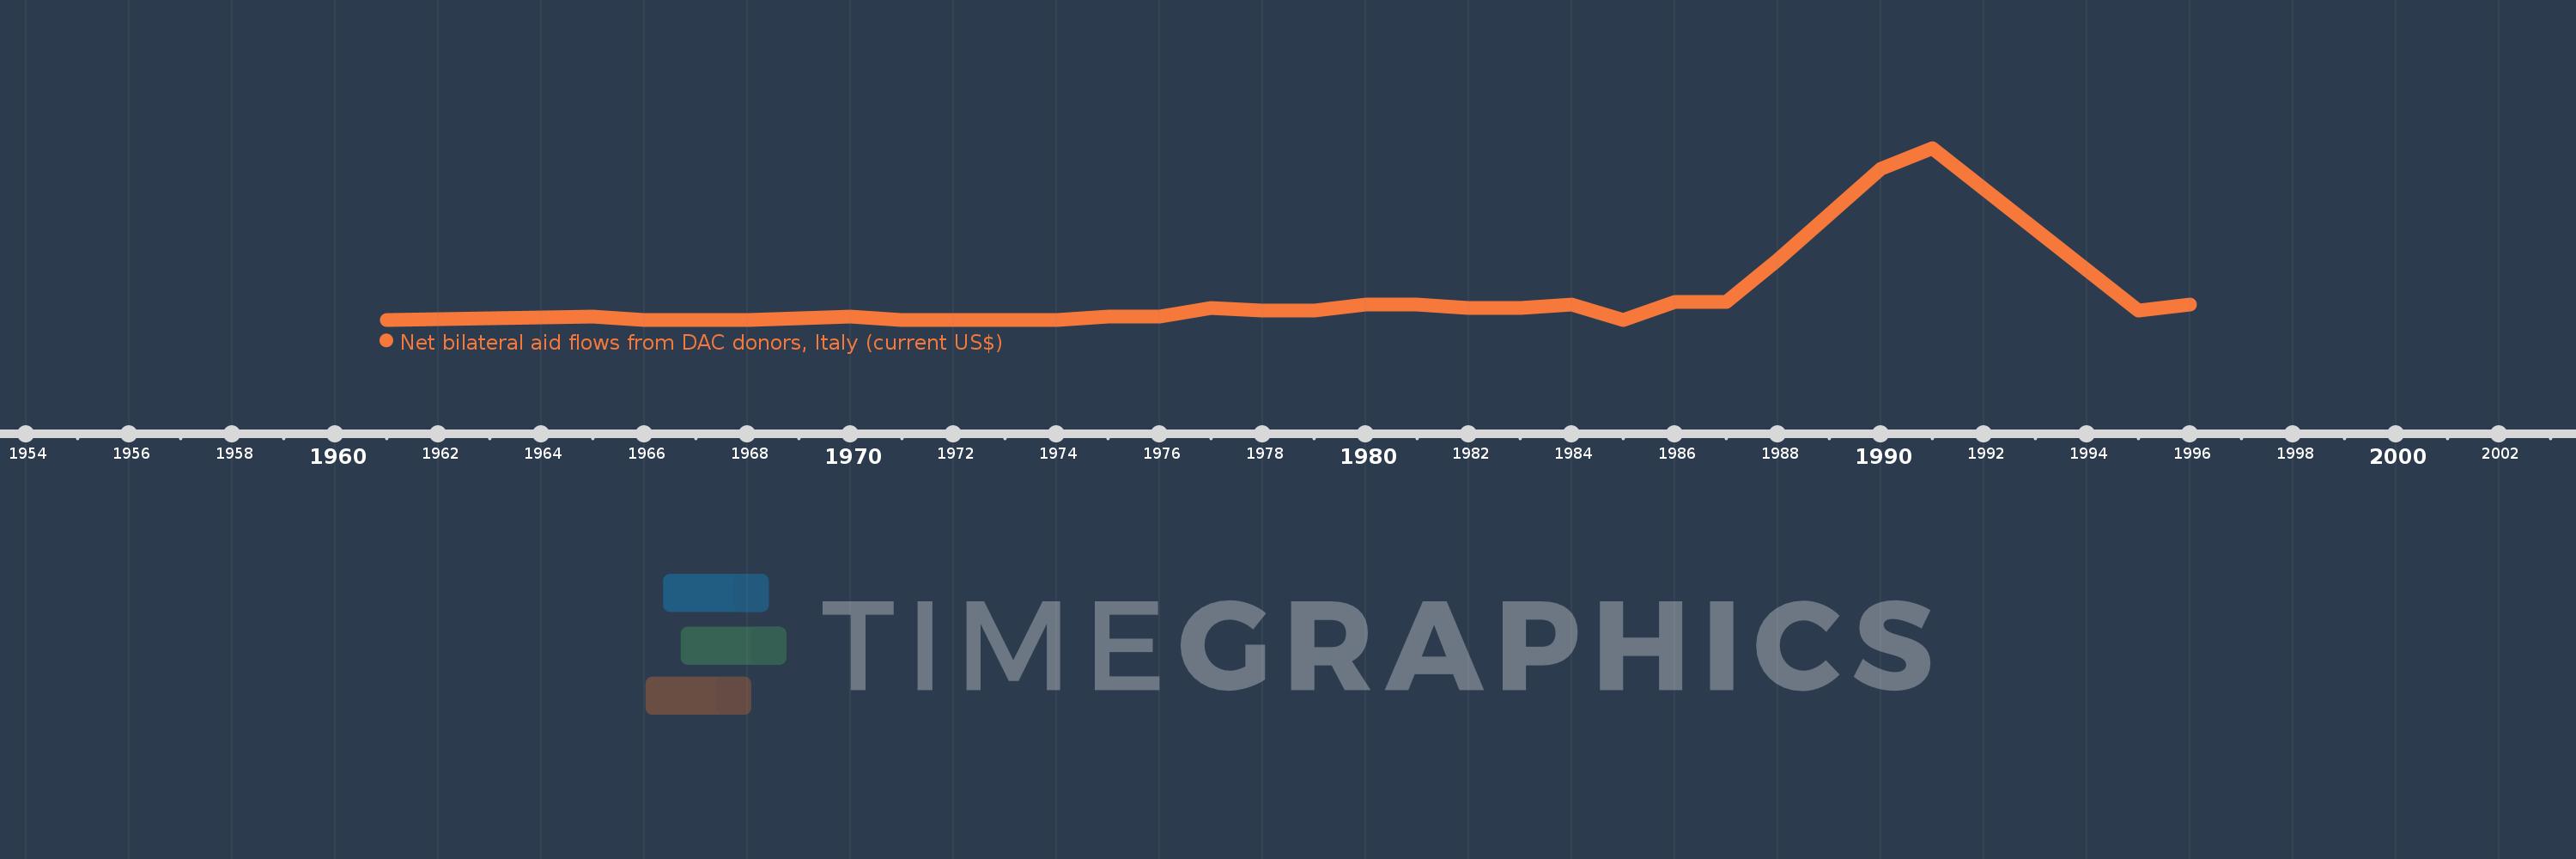
Net bilateral aid flows from DAC donors, Italy (current US$)
1996,1995,1991,1990,1989,1988,1987,1986,1985,1984,1983,1982,1981,1980,1979,1978,1977,1976,1975,1974,1971,1970,1968,1966,1965,1961