29
/de/
de
AIzaSyAYiBZKx7MnpbEhh9jyipgxe19OcubqV5w
April 1, 2024
184212
Macedonia, FYR
MKD
true
2
1
Net bilateral aid flows from DAC donors, Italy (current US$)
2015,2014,2013,2011,2010,2009,2008,2007,2006,2005,2004,2003,2002,2001,2000,1999,1997,1996,1995
Download
Bibliothek der Globalstatistik →Macedonia, FYR →

Net bilateral aid flows from DAC donors, Italy (current US$)

Diese Statistik in anderen Ländern:
AfghanistanAlbaniaAlgeriaAngolaAntigua and BarbudaArab WorldArgentinaArmeniaAzerbaijanBahamas, TheBangladeshBarbadosBelarusBelizeBeninBhutanBoliviaBosnia and HerzegovinaBotswanaBrazilBulgariaBurkina FasoBurundiCabo VerdeCambodiaCameroonCaribbean small statesCentral African RepublicCentral Europe and the BalticsChadChileChinaColombiaComorosCongo, Dem. Rep.Congo, Rep.Costa RicaCote d'IvoireCroatiaCubaCyprusCzech RepublicDjiboutiDominicaDominican RepublicEast Asia & PacificEast Asia & Pacific (excluding high income)East Asia & Pacific (IDA & IBRD countries)EcuadorEgypt, Arab Rep.El SalvadorEquatorial GuineaEritreaEstoniaEthiopiaEuro areaEurope & Central AsiaEurope & Central Asia (excluding high income)Europe & Central Asia (IDA & IBRD countries)European UnionFijiFragile and conflict affected situationsGabonGambia, TheGeorgiaGhanaGuatemalaGuineaGuinea-BissauGuyanaHaitiHeavily indebted poor countries (HIPC)High incomeHondurasHong Kong SAR, ChinaHungaryIBRD onlyIDA & IBRD totalIDA blendIDA onlyIDA totalIndiaIndonesiaIran, Islamic Rep.IraqIsraelJamaicaJordanKazakhstanKenyaKiribatiKorea, Dem. People’s Rep.Korea, Rep.KosovoKuwaitKyrgyz RepublicLao PDRLatin America & Caribbean Latin America & Caribbean (excluding high income)Latin America & the Caribbean (IDA & IBRD countries)LatviaLeast developed countries: UN classificationLebanonLesothoLiberiaLibyaLithuaniaLow & middle incomeLow incomeLower middle incomeMacedonia, FYRMadagascarMalawiMalaysiaMaldivesMaliMaltaMarshall IslandsMauritaniaMauritiusMexicoMiddle East & North AfricaMiddle East & North Africa (excluding high income)Middle East & North Africa (IDA & IBRD countries)Middle incomeMoldovaMongoliaMontenegroMoroccoMozambiqueMyanmarNamibiaNauruNepalNicaraguaNigerNigeriaOECD membersOmanOther small statesPacific island small statesPakistanPalauPanamaPapua New GuineaParaguayPeruPhilippinesPolandRomaniaRussian FederationRwandaSamoaSao Tome and PrincipeSaudi ArabiaSenegalSerbiaSeychellesSierra LeoneSingaporeSlovak RepublicSloveniaSmall statesSolomon IslandsSomaliaSouth AfricaSouth AsiaSouth Asia (IDA & IBRD)South SudanSri LankaSt. Kitts and NevisSt. LuciaSt. Vincent and the GrenadinesSub-Saharan Africa Sub-Saharan Africa (excluding high income)Sub-Saharan Africa (IDA & IBRD countries)SudanSurinameSwazilandSyrian Arab RepublicTajikistanTanzaniaThailandTimor-LesteTogoTongaTrinidad and TobagoTunisiaTurkeyTurkmenistanTuvaluUgandaUkraineUnited Arab EmiratesUpper middle incomeUruguayUzbekistanVanuatuVenezuela, RBVietnamWest Bank and GazaWorldYemen, Rep.ZambiaZimbabwe
Zeitlinie:
Diese Zeitleiste vorliegt die Graphik ab 1995 J. bis 2015 J. Macedonia, FYR. Die Angaben bis 1994 J. sind nicht vorhanden. Die Zahl aktueller Beobachtungen nach Daten: 19.
Die Quelle (Bezeichnung):
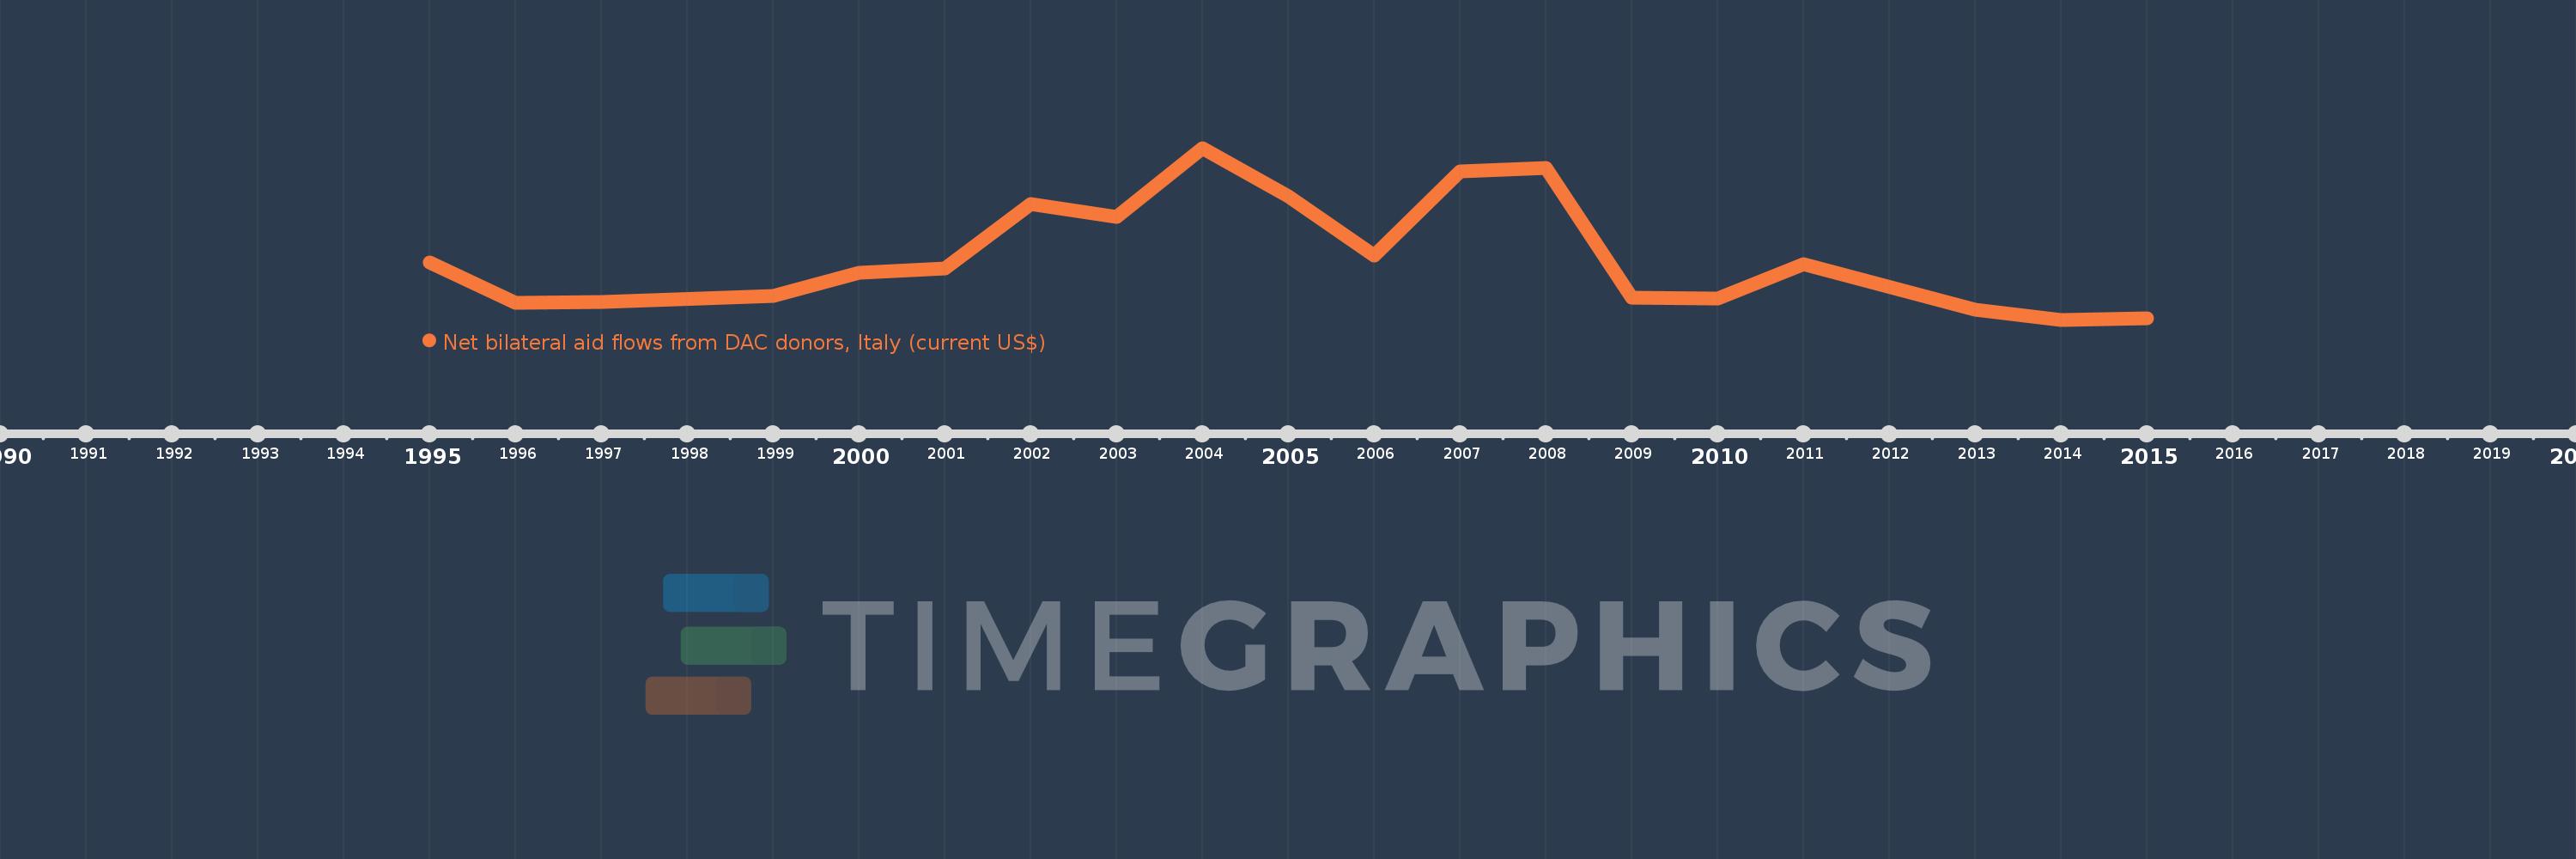
Kennzahlen der Weltentwicklung
Die Quelle (Einrichtung):
Development Assistance Committee of the Organisation for Economic Co-operation and Development, Geographical Distribution of Financial Flows to Developing Countries, Development Co-operation Report, and International Development Statistics database. Data are available online at: www.oecd.org/dac/stats/idsonline.
Kategorien:
Aid Effectiveness
Es wurde aktualisiert:
23 Apr 2017 Jahr
Kennzahlen der Wertänderungen vom Jahr zum Jahr
im Durchschnitt:
2.545 Mln.
Minimum:
-890.0 Tsnd.
1 Jan 2014 Jahr
Maximum:
8.43 Mln.
1 Jan 2004 Jahr
Zum Datum der Beobachtung
Wert
Absolute Veränderung
Die Veränderung bezüglich dem vorherigen Wert
1 Jan 1995 Jahr
2.22 Mln.
+2.22 Mln.
0.0%
1 Jan 1996 Jahr
20.0 Tsnd.
-2.2 Mln.
-99.1%
1 Jan 1997 Jahr
60.0 Tsnd.
+40.0 Tsnd.
200.0%
1 Jan 1999 Jahr
410.0 Tsnd.
+350.0 Tsnd.
583.33%
1 Jan 2000 Jahr
1.68 Mln.
+1.27 Mln.
309.76%
1 Jan 2001 Jahr
1.9 Mln.
+220.0 Tsnd.
13.1%
1 Jan 2002 Jahr
5.4 Mln.
+3.5 Mln.
184.21%
1 Jan 2003 Jahr
4.68 Mln.
-720.0 Tsnd.
-13.33%
1 Jan 2004 Jahr
8.43 Mln.
+3.75 Mln.
80.13%
1 Jan 2005 Jahr
5.82 Mln.
-2.61 Mln.
-30.96%
1 Jan 2006 Jahr
2.59 Mln.
-3.23 Mln.
-55.5%
1 Jan 2007 Jahr
7.16 Mln.
+4.57 Mln.
176.45%
1 Jan 2008 Jahr
7.34 Mln.
+180.0 Tsnd.
2.51%
1 Jan 2009 Jahr
330.0 Tsnd.
-7.01 Mln.
-95.5%
1 Jan 2010 Jahr
250.0 Tsnd.
-80.0 Tsnd.
-24.24%
1 Jan 2011 Jahr
2.12 Mln.
+1.87 Mln.
748.0%
1 Jan 2013 Jahr
-350.0 Tsnd.
-2.47 Mln.
-116.51%
1 Jan 2014 Jahr
-890.0 Tsnd.
-540.0 Tsnd.
154.29%
1 Jan 2015 Jahr
-820.0 Tsnd.
+70.0 Tsnd.
-7.87%
Bewertung der Länder gemäß mit laufender Statistik nach Jahren

Kommentare:

Abschicken
PremiumAbout & FeedbackVereinbarungPrivatheit
logo
© 2022 Selected Technologies LLC – Morgan Hill, California