30
/de/
AIzaSyAYiBZKx7MnpbEhh9jyipgxe19OcubqV5w
April 1, 2024
29882
Euro area
EMU
false
2
1
GNI, PPP (current international $)
2016,2015,2014,2013,2012,2011,2010,2009,2008,2007,2006,2005,2004,2003,2002,2001,2000,1999,1998,1997,1996,1995,1994,1993,1992,1991
Download
Bibliothek der Globalstatistik →Euro area →

GNI, PPP (current international $)

Diese Statistik in anderen Ländern:

AfghanistanAlbaniaAlgeriaAngolaAntigua and BarbudaArab WorldArgentinaArmeniaAustraliaAustriaAzerbaijanBahamas, TheBahrainBangladeshBarbadosBelarusBelgiumBelizeBeninBermudaBhutanBoliviaBosnia and HerzegovinaBotswanaBrazilBrunei DarussalamBulgariaBurkina FasoBurundiCabo VerdeCambodiaCameroonCanadaCaribbean small statesCentral African RepublicCentral Europe and the BalticsChadChileChinaColombiaComorosCongo, Dem. Rep.Congo, Rep.Costa RicaCote d'IvoireCroatiaCubaCyprusCzech RepublicDenmarkDjiboutiDominicaDominican RepublicEarly-demographic dividendEast Asia & PacificEast Asia & Pacific (excluding high income)East Asia & Pacific (IDA & IBRD countries)EcuadorEgypt, Arab Rep.El SalvadorEquatorial GuineaEritreaEstoniaEthiopiaEuro areaEurope & Central AsiaEurope & Central Asia (excluding high income)Europe & Central Asia (IDA & IBRD countries)European UnionFijiFinlandFragile and conflict affected situationsFranceGabonGambia, TheGeorgiaGermanyGhanaGreeceGrenadaGuatemalaGuineaGuinea-BissauGuyanaHaitiHeavily indebted poor countries (HIPC)High incomeHondurasHong Kong SAR, ChinaHungaryIBRD onlyIcelandIDA & IBRD totalIDA blendIDA onlyIDA totalIndiaIndonesiaIran, Islamic Rep.IraqIrelandIsraelItalyJamaicaJapanJordanKazakhstanKenyaKiribatiKorea, Rep.KosovoKuwaitKyrgyz RepublicLao PDRLate-demographic dividendLatin America & Caribbean Latin America & Caribbean (excluding high income)Latin America & the Caribbean (IDA & IBRD countries)LatviaLeast developed countries: UN classificationLebanonLesothoLiberiaLibyaLithuaniaLow & middle incomeLow incomeLower middle incomeLuxembourgMacao SAR, ChinaMacedonia, FYRMadagascarMalawiMalaysiaMaldivesMaliMaltaMarshall IslandsMauritaniaMauritiusMexicoMicronesia, Fed. Sts.Middle East & North AfricaMiddle East & North Africa (excluding high income)Middle East & North Africa (IDA & IBRD countries)Middle incomeMoldovaMongoliaMontenegroMoroccoMozambiqueMyanmarNamibiaNauruNepalNetherlandsNew ZealandNicaraguaNigerNigeriaNorth AmericaNorwayOECD membersOmanOther small statesPacific island small statesPakistanPalauPanamaPapua New GuineaParaguayPeruPhilippinesPolandPortugalPost-demographic dividendPre-demographic dividendPuerto RicoQatarRomaniaRussian FederationRwandaSamoaSao Tome and PrincipeSaudi ArabiaSenegalSerbiaSeychellesSierra LeoneSingaporeSlovak RepublicSloveniaSmall statesSolomon IslandsSouth AfricaSouth AsiaSouth Asia (IDA & IBRD)South SudanSpainSri LankaSt. Kitts and NevisSt. LuciaSt. Vincent and the GrenadinesSub-Saharan Africa Sub-Saharan Africa (excluding high income)Sub-Saharan Africa (IDA & IBRD countries)SudanSurinameSwazilandSwedenSwitzerlandTajikistanTanzaniaThailandTimor-LesteTogoTongaTrinidad and TobagoTunisiaTurkeyTurkmenistanTuvaluUgandaUkraineUnited Arab EmiratesUnited KingdomUnited StatesUpper middle incomeUruguayUzbekistanVanuatuVenezuela, RBVietnamWest Bank and GazaWorldYemen, Rep.ZambiaZimbabwe

Zeitlinie:

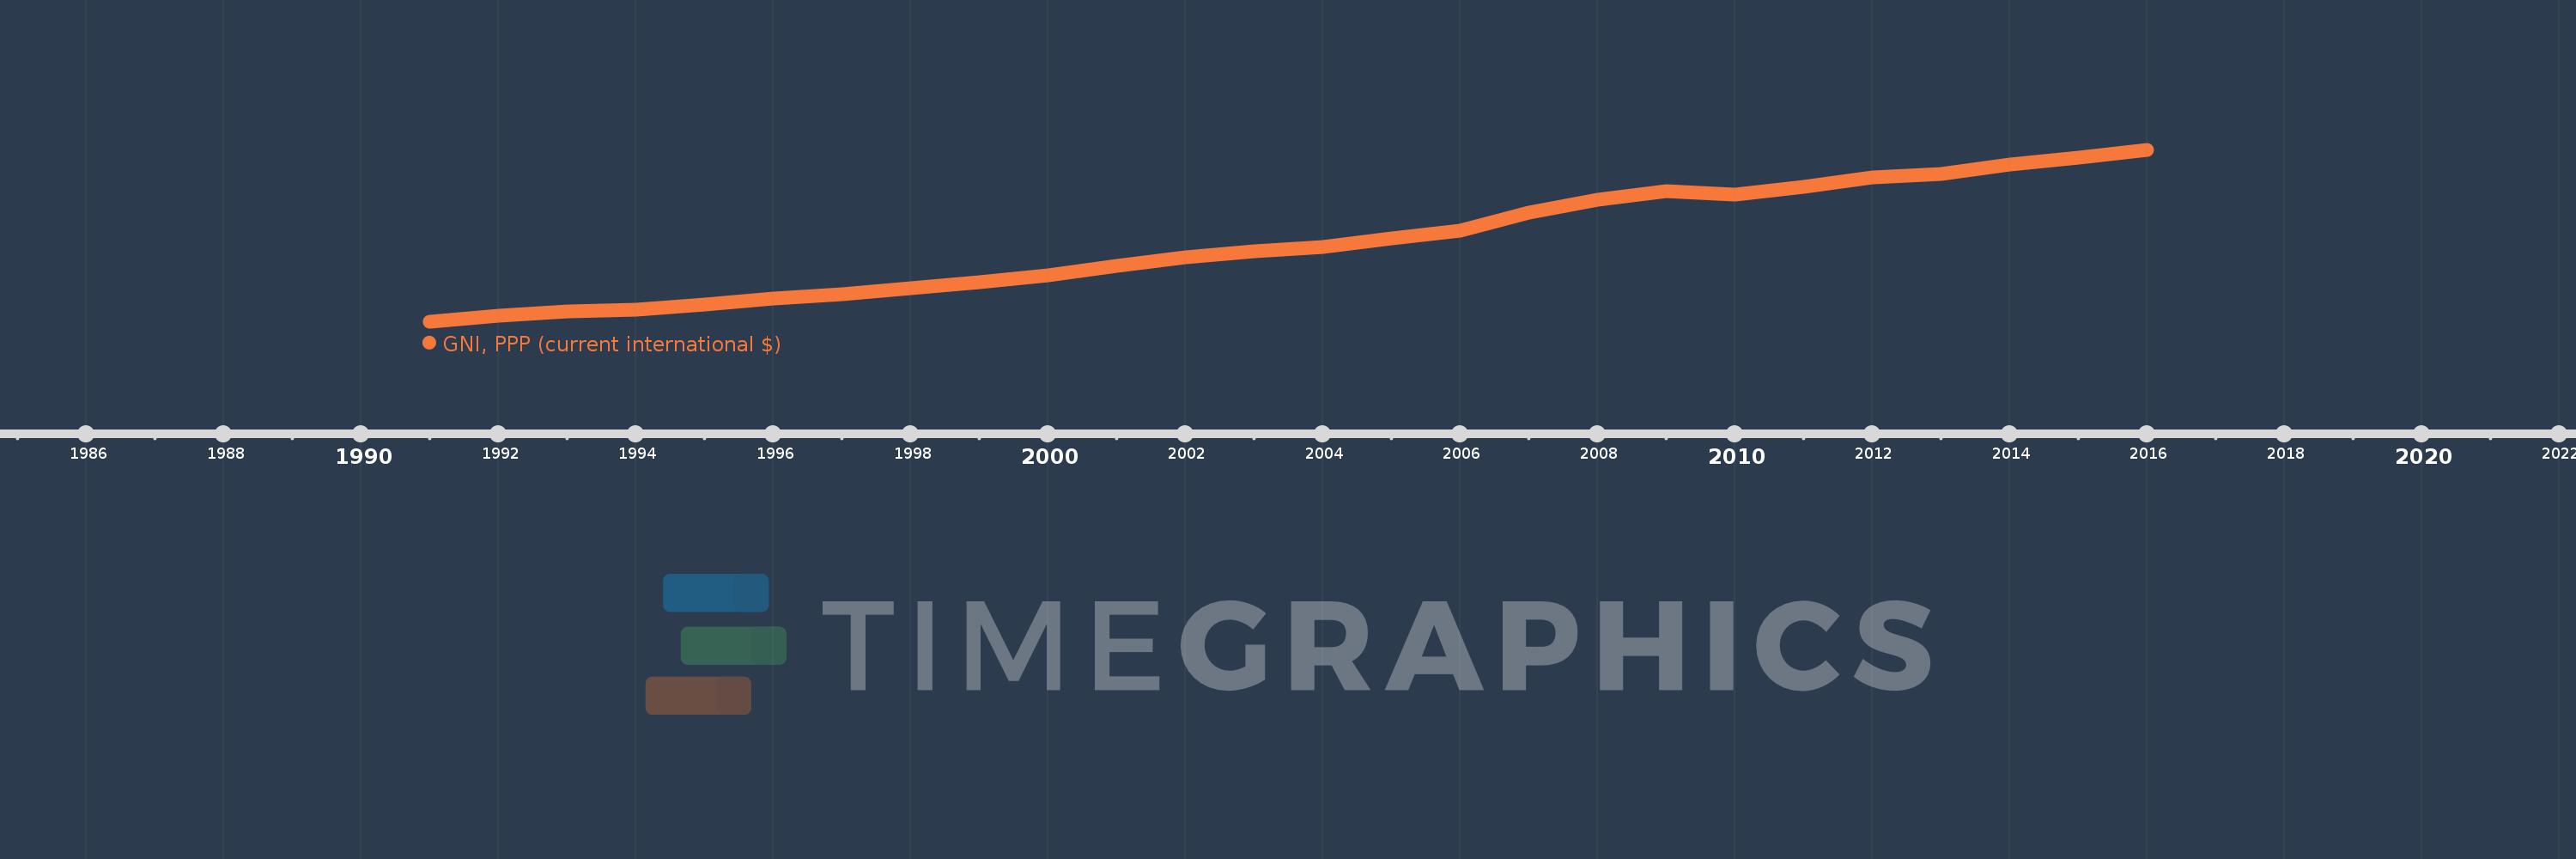
Diese Zeitleiste vorliegt die Graphik ab 1991 J. bis 2016 J. Euro area. Die Angaben bis 1990 J. sind nicht vorhanden. Die Zahl aktueller Beobachtungen nach Daten: 26.

Die Quelle (Bezeichnung):

Kennzahlen der Weltentwicklung

Die Quelle (Einrichtung):

World Bank, International Comparison Program database.

Kategorien:

Economy & Growth

Es wurde aktualisiert:

23 Apr 2017 Jahr

Kennzahlen der Wertänderungen vom Jahr zum Jahr

im Durchschnitt:
9.317 Trln
Minimum:
5.302 Trln
1 Jan 1991 Jahr
Maximum:
13.975 Trln
1 Jan 2016 Jahr
Zum Datum der Beobachtung
Wert
Absolute Veränderung
Die Veränderung bezüglich dem vorherigen Wert
1 Jan 1991 Jahr
5.302 Trln
+5.302 Trln
0.0%
1 Jan 1992 Jahr
5.615 Trln
+312.61 Mlrd.
5.9%
1 Jan 1993 Jahr
5.821 Trln
+206.071 Mlrd.
3.67%
1 Jan 1994 Jahr
5.92 Trln
+99.087 Mlrd.
1.7%
1 Jan 1995 Jahr
6.177 Trln
+257.653 Mlrd.
4.35%
1 Jan 1996 Jahr
6.47 Trln
+292.214 Mlrd.
4.73%
1 Jan 1997 Jahr
6.701 Trln
+231.572 Mlrd.
3.58%
1 Jan 1998 Jahr
6.989 Trln
+288.273 Mlrd.
4.3%
1 Jan 1999 Jahr
7.313 Trln
+323.853 Mlrd.
4.63%
1 Jan 2000 Jahr
7.64 Trln
+326.519 Mlrd.
4.46%
1 Jan 2001 Jahr
8.14 Trln
+499.816 Mlrd.
6.54%
1 Jan 2002 Jahr
8.548 Trln
+407.876 Mlrd.
5.01%
1 Jan 2003 Jahr
8.879 Trln
+331.3 Mlrd.
3.88%
1 Jan 2004 Jahr
9.076 Trln
+196.929 Mlrd.
2.22%
1 Jan 2005 Jahr
9.542 Trln
+466.093 Mlrd.
5.14%
1 Jan 2006 Jahr
9.933 Trln
+391.281 Mlrd.
4.1%
1 Jan 2007 Jahr
10.809 Trln
+875.651 Mlrd.
8.82%
1 Jan 2008 Jahr
11.452 Trln
+643.423 Mlrd.
5.95%
1 Jan 2009 Jahr
11.899 Trln
+447.122 Mlrd.
3.9%
1 Jan 2010 Jahr
11.72 Trln
-179.218 Mlrd.
-1.51%
1 Jan 2011 Jahr
12.105 Trln
+385.171 Mlrd.
3.29%
1 Jan 2012 Jahr
12.612 Trln
+507.076 Mlrd.
4.19%
1 Jan 2013 Jahr
12.776 Trln
+163.241 Mlrd.
1.29%
1 Jan 2014 Jahr
13.238 Trln
+462.069 Mlrd.
3.62%
1 Jan 2015 Jahr
13.578 Trln
+339.994 Mlrd.
2.57%
1 Jan 2016 Jahr
13.975 Trln
+397.538 Mlrd.
2.93%

Bewertung der Länder gemäß mit laufender Statistik nach Jahren