30
/de/
AIzaSyAYiBZKx7MnpbEhh9jyipgxe19OcubqV5w
April 1, 2024
134139
France
FRA
true
2
1
GNI, PPP (current international $)
2016,2015,2014,2013,2012,2011,2010,2009,2008,2007,2006,2005,2004,2003,2002,2001,2000,1999,1998,1997,1996,1995,1994,1993,1992,1991
Download
Bibliothek der Globalstatistik →France →

GNI, PPP (current international $)

Diese Statistik in anderen Ländern:

AfghanistanAlbaniaAlgeriaAngolaAntigua and BarbudaArab WorldArgentinaArmeniaAustraliaAustriaAzerbaijanBahamas, TheBahrainBangladeshBarbadosBelarusBelgiumBelizeBeninBermudaBhutanBoliviaBosnia and HerzegovinaBotswanaBrazilBrunei DarussalamBulgariaBurkina FasoBurundiCabo VerdeCambodiaCameroonCanadaCaribbean small statesCentral African RepublicCentral Europe and the BalticsChadChileChinaColombiaComorosCongo, Dem. Rep.Congo, Rep.Costa RicaCote d'IvoireCroatiaCubaCyprusCzech RepublicDenmarkDjiboutiDominicaDominican RepublicEarly-demographic dividendEast Asia & PacificEast Asia & Pacific (excluding high income)East Asia & Pacific (IDA & IBRD countries)EcuadorEgypt, Arab Rep.El SalvadorEquatorial GuineaEritreaEstoniaEthiopiaEuro areaEurope & Central AsiaEurope & Central Asia (excluding high income)Europe & Central Asia (IDA & IBRD countries)European UnionFijiFinlandFragile and conflict affected situationsFranceGabonGambia, TheGeorgiaGermanyGhanaGreeceGrenadaGuatemalaGuineaGuinea-BissauGuyanaHaitiHeavily indebted poor countries (HIPC)High incomeHondurasHong Kong SAR, ChinaHungaryIBRD onlyIcelandIDA & IBRD totalIDA blendIDA onlyIDA totalIndiaIndonesiaIran, Islamic Rep.IraqIrelandIsraelItalyJamaicaJapanJordanKazakhstanKenyaKiribatiKorea, Rep.KosovoKuwaitKyrgyz RepublicLao PDRLate-demographic dividendLatin America & Caribbean Latin America & Caribbean (excluding high income)Latin America & the Caribbean (IDA & IBRD countries)LatviaLeast developed countries: UN classificationLebanonLesothoLiberiaLibyaLithuaniaLow & middle incomeLow incomeLower middle incomeLuxembourgMacao SAR, ChinaMacedonia, FYRMadagascarMalawiMalaysiaMaldivesMaliMaltaMarshall IslandsMauritaniaMauritiusMexicoMicronesia, Fed. Sts.Middle East & North AfricaMiddle East & North Africa (excluding high income)Middle East & North Africa (IDA & IBRD countries)Middle incomeMoldovaMongoliaMontenegroMoroccoMozambiqueMyanmarNamibiaNauruNepalNetherlandsNew ZealandNicaraguaNigerNigeriaNorth AmericaNorwayOECD membersOmanOther small statesPacific island small statesPakistanPalauPanamaPapua New GuineaParaguayPeruPhilippinesPolandPortugalPost-demographic dividendPre-demographic dividendPuerto RicoQatarRomaniaRussian FederationRwandaSamoaSao Tome and PrincipeSaudi ArabiaSenegalSerbiaSeychellesSierra LeoneSingaporeSlovak RepublicSloveniaSmall statesSolomon IslandsSouth AfricaSouth AsiaSouth Asia (IDA & IBRD)South SudanSpainSri LankaSt. Kitts and NevisSt. LuciaSt. Vincent and the GrenadinesSub-Saharan Africa Sub-Saharan Africa (excluding high income)Sub-Saharan Africa (IDA & IBRD countries)SudanSurinameSwazilandSwedenSwitzerlandTajikistanTanzaniaThailandTimor-LesteTogoTongaTrinidad and TobagoTunisiaTurkeyTurkmenistanTuvaluUgandaUkraineUnited Arab EmiratesUnited KingdomUnited StatesUpper middle incomeUruguayUzbekistanVanuatuVenezuela, RBVietnamWest Bank and GazaWorldYemen, Rep.ZambiaZimbabwe

Zeitlinie:

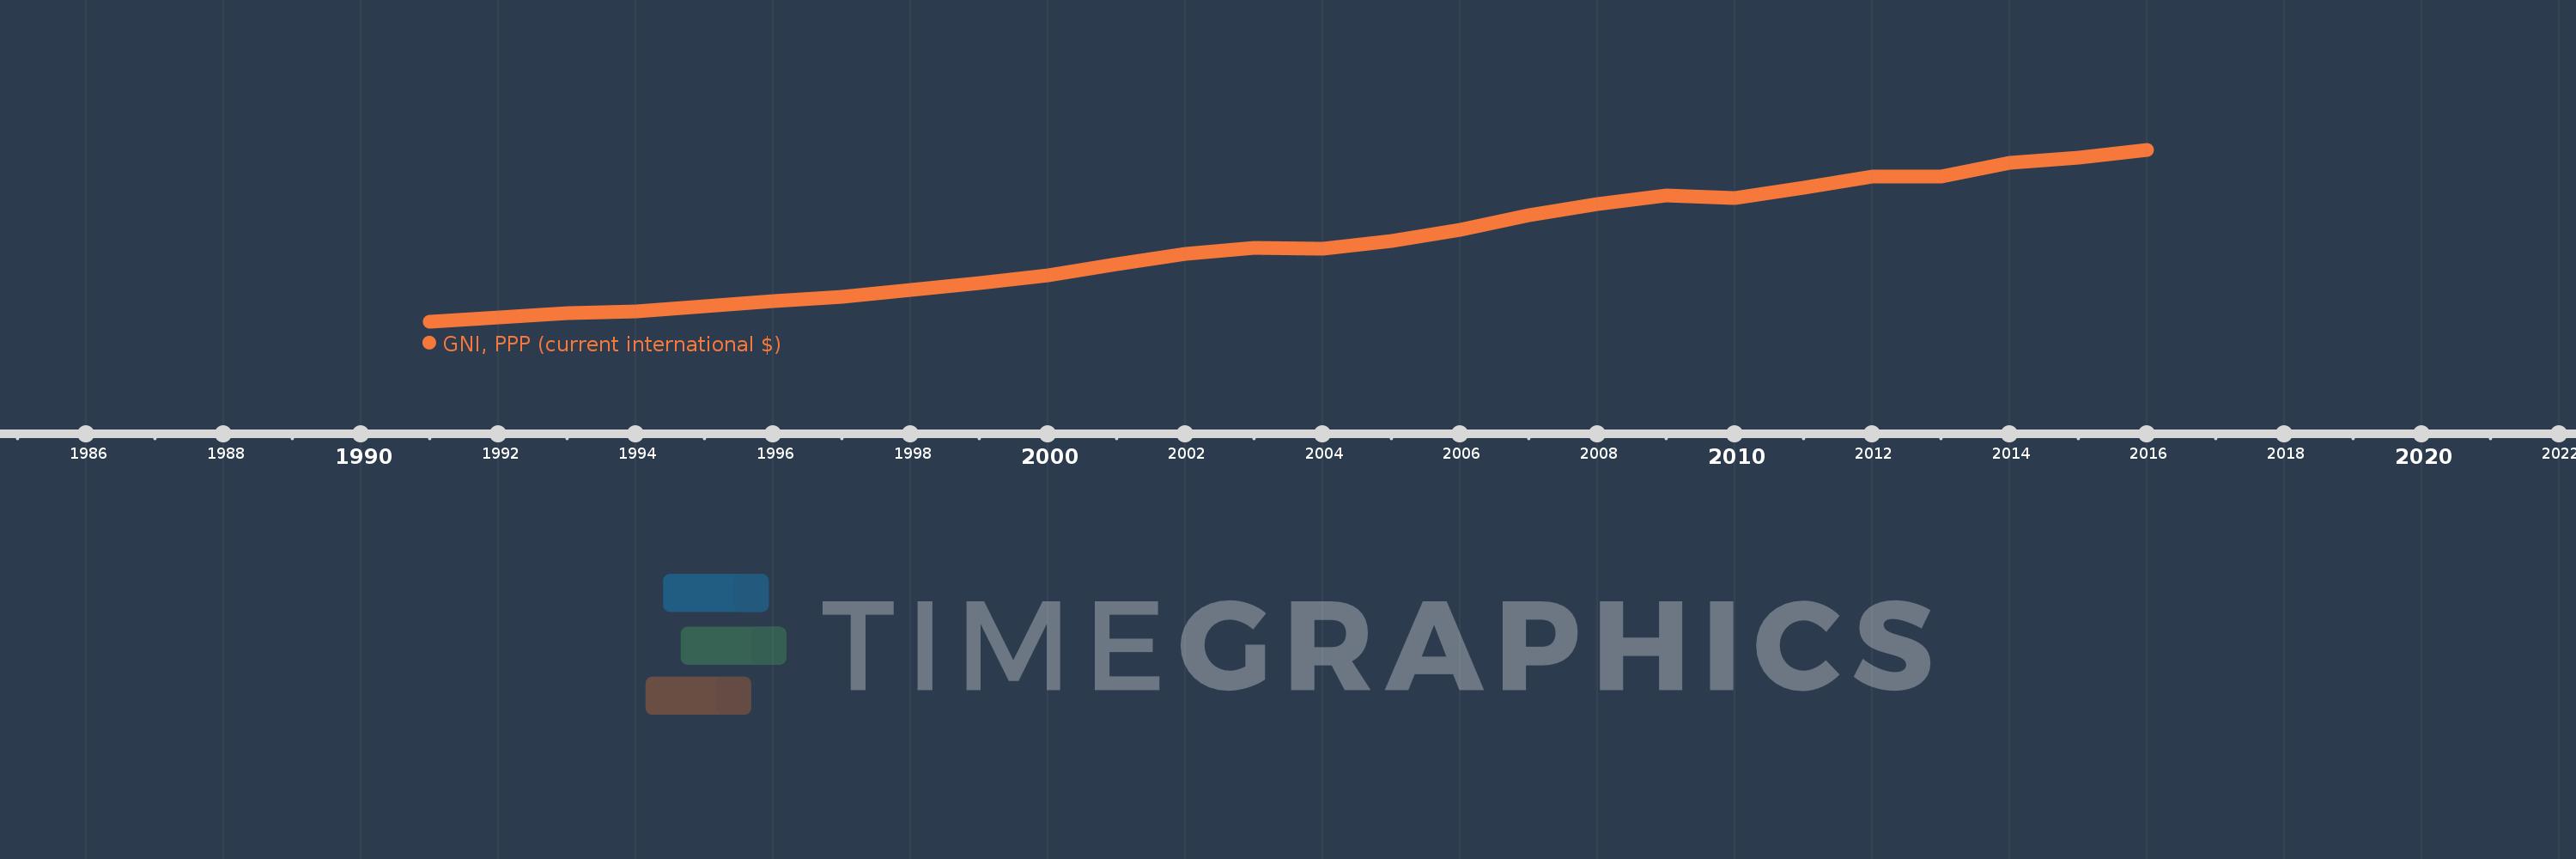
Diese Zeitleiste vorliegt die Graphik ab 1991 J. bis 2016 J. France. Die Angaben bis 1990 J. sind nicht vorhanden. Die Zahl aktueller Beobachtungen nach Daten: 26.

Die Quelle (Bezeichnung):

Kennzahlen der Weltentwicklung

Die Quelle (Einrichtung):

World Bank, International Comparison Program database.

Kategorien:

Economy & Growth

Es wurde aktualisiert:

23 Apr 2017 Jahr

Kennzahlen der Wertänderungen vom Jahr zum Jahr

im Durchschnitt:
1.832 Trln
Minimum:
1.037 Trln
1 Jan 1991 Jahr
Maximum:
2.774 Trln
1 Jan 2016 Jahr
Zum Datum der Beobachtung
Wert
Absolute Veränderung
Die Veränderung bezüglich dem vorherigen Wert
1 Jan 1991 Jahr
1.037 Trln
+1.037 Trln
0.0%
1 Jan 1992 Jahr
1.082 Trln
+45.256 Mlrd.
4.37%
1 Jan 1993 Jahr
1.126 Trln
+44.554 Mlrd.
4.12%
1 Jan 1994 Jahr
1.147 Trln
+20.937 Mlrd.
1.86%
1 Jan 1995 Jahr
1.197 Trln
+49.467 Mlrd.
4.31%
1 Jan 1996 Jahr
1.247 Trln
+50.033 Mlrd.
4.18%
1 Jan 1997 Jahr
1.294 Trln
+46.622 Mlrd.
3.74%
1 Jan 1998 Jahr
1.357 Trln
+63.569 Mlrd.
4.91%
1 Jan 1999 Jahr
1.431 Trln
+73.397 Mlrd.
5.41%
1 Jan 2000 Jahr
1.508 Trln
+77.742 Mlrd.
5.43%
1 Jan 2001 Jahr
1.625 Trln
+117.069 Mlrd.
7.76%
1 Jan 2002 Jahr
1.729 Trln
+103.6 Mlrd.
6.37%
1 Jan 2003 Jahr
1.788 Trln
+59.129 Mlrd.
3.42%
1 Jan 2004 Jahr
1.781 Trln
-7.203 Mlrd.
-0.4%
1 Jan 2005 Jahr
1.856 Trln
+74.827 Mlrd.
4.2%
1 Jan 2006 Jahr
1.967 Trln
+111.646 Mlrd.
6.02%
1 Jan 2007 Jahr
2.112 Trln
+144.782 Mlrd.
7.36%
1 Jan 2008 Jahr
2.232 Trln
+119.596 Mlrd.
5.66%
1 Jan 2009 Jahr
2.312 Trln
+79.82 Mlrd.
3.58%
1 Jan 2010 Jahr
2.29 Trln
-21.654 Mlrd.
-0.94%
1 Jan 2011 Jahr
2.391 Trln
+100.708 Mlrd.
4.4%
1 Jan 2012 Jahr
2.504 Trln
+113.356 Mlrd.
4.74%
1 Jan 2013 Jahr
2.507 Trln
+2.918 Mlrd.
0.12%
1 Jan 2014 Jahr
2.645 Trln
+138.026 Mlrd.
5.51%
1 Jan 2015 Jahr
2.696 Trln
+51.149 Mlrd.
1.93%
1 Jan 2016 Jahr
2.774 Trln
+77.487 Mlrd.
2.87%

Bewertung der Länder gemäß mit laufender Statistik nach Jahren