33
/de/
AIzaSyAYiBZKx7MnpbEhh9jyipgxe19OcubqV5w
August 1, 2025
161498
Italy
ITA
true
2
1
GNI, PPP (current international $)
2016,2015,2014,2013,2012,2011,2010,2009,2008,2007,2006,2005,2004,2003,2002,2001,2000,1999,1998,1997,1996,1995,1994,1993,1992,1991
Download
Bibliothek der Globalstatistik →Italy →

GNI, PPP (current international $)

Diese Statistik in anderen Ländern:

AfghanistanAlbaniaAlgeriaAngolaAntigua and BarbudaArab WorldArgentinaArmeniaAustraliaAustriaAzerbaijanBahamas, TheBahrainBangladeshBarbadosBelarusBelgiumBelizeBeninBermudaBhutanBoliviaBosnia and HerzegovinaBotswanaBrazilBrunei DarussalamBulgariaBurkina FasoBurundiCabo VerdeCambodiaCameroonCanadaCaribbean small statesCentral African RepublicCentral Europe and the BalticsChadChileChinaColombiaComorosCongo, Dem. Rep.Congo, Rep.Costa RicaCote d'IvoireCroatiaCubaCyprusCzech RepublicDenmarkDjiboutiDominicaDominican RepublicEarly-demographic dividendEast Asia & PacificEast Asia & Pacific (excluding high income)East Asia & Pacific (IDA & IBRD countries)EcuadorEgypt, Arab Rep.El SalvadorEquatorial GuineaEritreaEstoniaEthiopiaEuro areaEurope & Central AsiaEurope & Central Asia (excluding high income)Europe & Central Asia (IDA & IBRD countries)European UnionFijiFinlandFragile and conflict affected situationsFranceGabonGambia, TheGeorgiaGermanyGhanaGreeceGrenadaGuatemalaGuineaGuinea-BissauGuyanaHaitiHeavily indebted poor countries (HIPC)High incomeHondurasHong Kong SAR, ChinaHungaryIBRD onlyIcelandIDA & IBRD totalIDA blendIDA onlyIDA totalIndiaIndonesiaIran, Islamic Rep.IraqIrelandIsraelItalyJamaicaJapanJordanKazakhstanKenyaKiribatiKorea, Rep.KosovoKuwaitKyrgyz RepublicLao PDRLate-demographic dividendLatin America & Caribbean Latin America & Caribbean (excluding high income)Latin America & the Caribbean (IDA & IBRD countries)LatviaLeast developed countries: UN classificationLebanonLesothoLiberiaLibyaLithuaniaLow & middle incomeLow incomeLower middle incomeLuxembourgMacao SAR, ChinaMacedonia, FYRMadagascarMalawiMalaysiaMaldivesMaliMaltaMarshall IslandsMauritaniaMauritiusMexicoMicronesia, Fed. Sts.Middle East & North AfricaMiddle East & North Africa (excluding high income)Middle East & North Africa (IDA & IBRD countries)Middle incomeMoldovaMongoliaMontenegroMoroccoMozambiqueMyanmarNamibiaNauruNepalNetherlandsNew ZealandNicaraguaNigerNigeriaNorth AmericaNorwayOECD membersOmanOther small statesPacific island small statesPakistanPalauPanamaPapua New GuineaParaguayPeruPhilippinesPolandPortugalPost-demographic dividendPre-demographic dividendPuerto RicoQatarRomaniaRussian FederationRwandaSamoaSao Tome and PrincipeSaudi ArabiaSenegalSerbiaSeychellesSierra LeoneSingaporeSlovak RepublicSloveniaSmall statesSolomon IslandsSouth AfricaSouth AsiaSouth Asia (IDA & IBRD)South SudanSpainSri LankaSt. Kitts and NevisSt. LuciaSt. Vincent and the GrenadinesSub-Saharan Africa Sub-Saharan Africa (excluding high income)Sub-Saharan Africa (IDA & IBRD countries)SudanSurinameSwazilandSwedenSwitzerlandTajikistanTanzaniaThailandTimor-LesteTogoTongaTrinidad and TobagoTunisiaTurkeyTurkmenistanTuvaluUgandaUkraineUnited Arab EmiratesUnited KingdomUnited StatesUpper middle incomeUruguayUzbekistanVanuatuVenezuela, RBVietnamWest Bank and GazaWorldYemen, Rep.ZambiaZimbabwe

Zeitlinie:

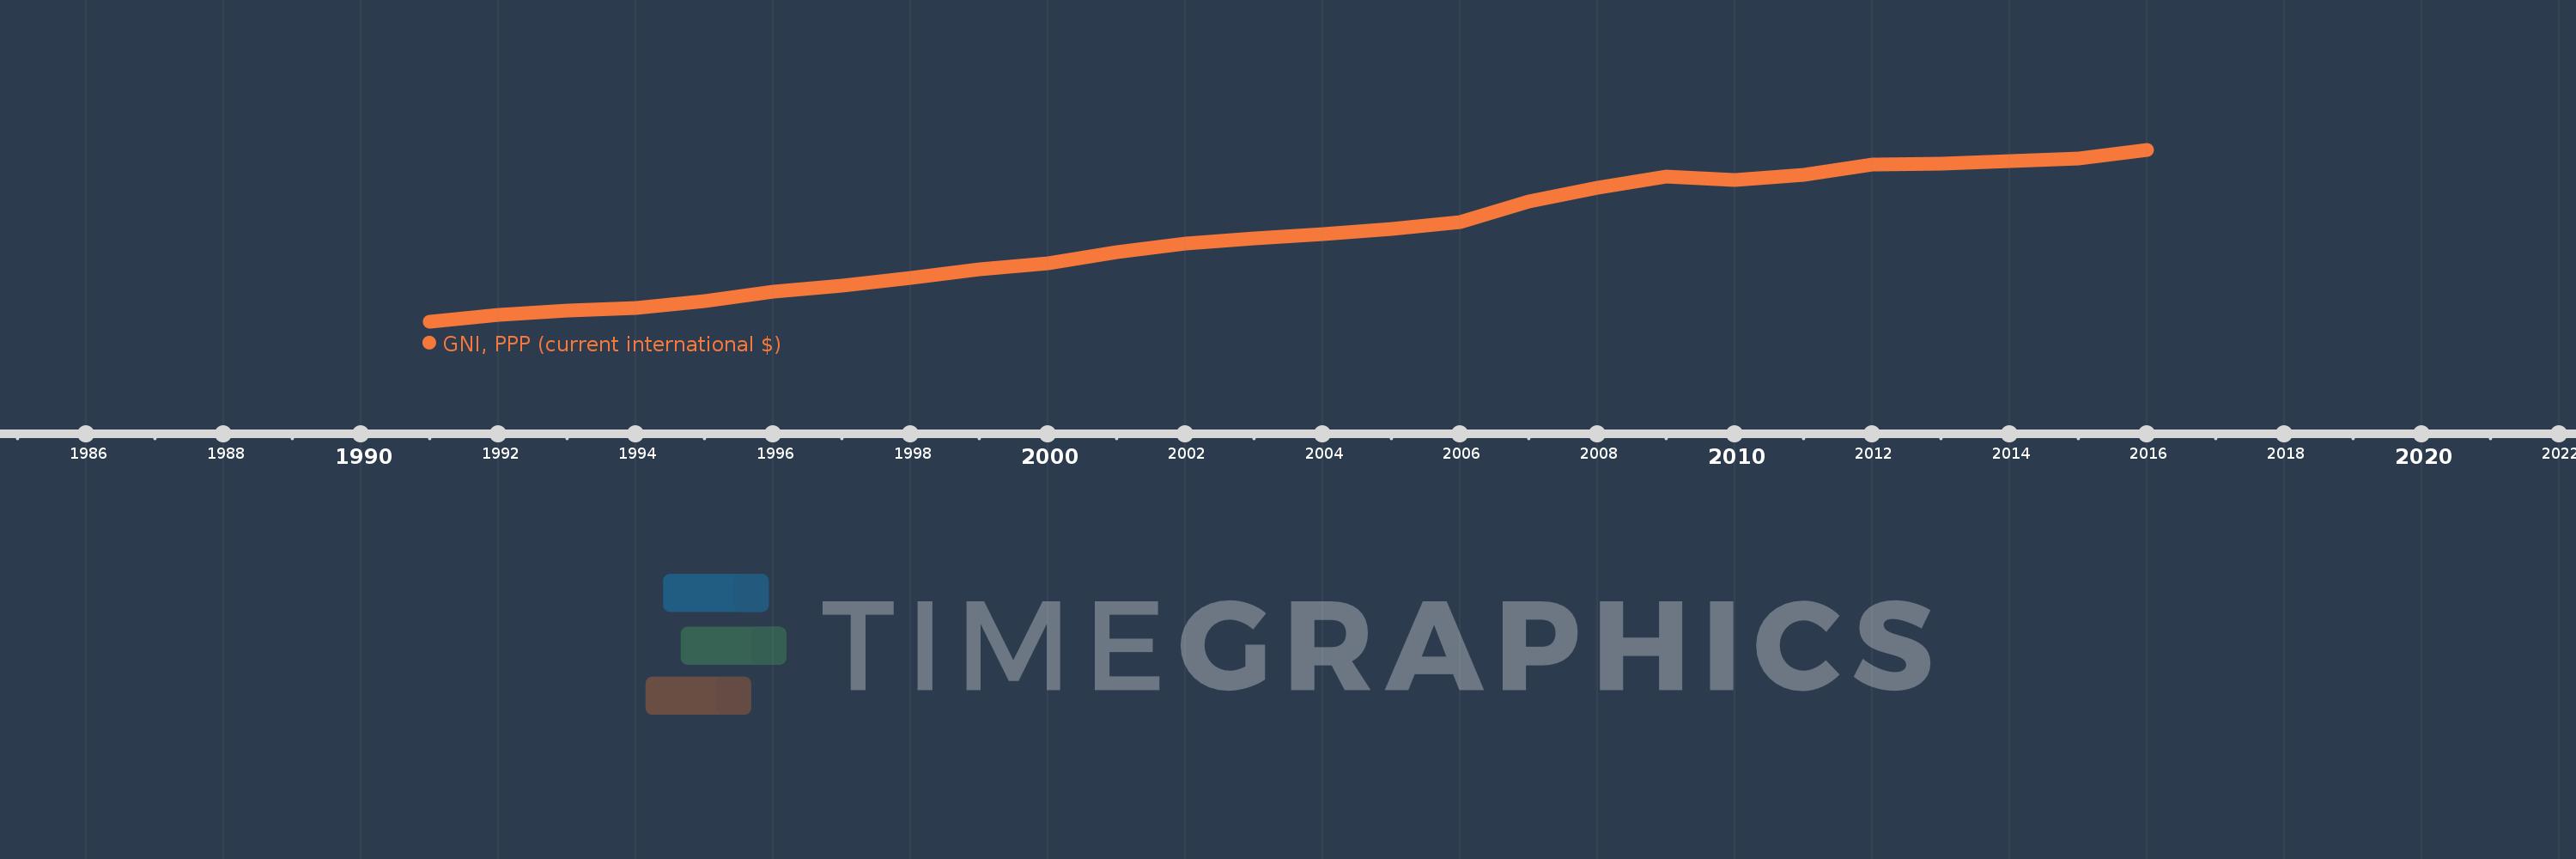
Diese Zeitleiste vorliegt die Graphik ab 1991 J. bis 2016 J. Italy. Die Angaben bis 1990 J. sind nicht vorhanden. Die Zahl aktueller Beobachtungen nach Daten: 26.

Die Quelle (Bezeichnung):

Kennzahlen der Weltentwicklung

Die Quelle (Einrichtung):

World Bank, International Comparison Program database.

Kategorien:

Economy & Growth

Es wurde aktualisiert:

23 Apr 2017 Jahr

Kennzahlen der Wertänderungen vom Jahr zum Jahr

im Durchschnitt:
1.659 Trln
Minimum:
1.039 Trln
1 Jan 1991 Jahr
Maximum:
2.249 Trln
1 Jan 2016 Jahr
Zum Datum der Beobachtung
Wert
Absolute Veränderung
Die Veränderung bezüglich dem vorherigen Wert
1 Jan 1991 Jahr
1.039 Trln
+1.039 Trln
0.0%
1 Jan 1992 Jahr
1.088 Trln
+48.877 Mlrd.
4.7%
1 Jan 1993 Jahr
1.12 Trln
+31.892 Mlrd.
2.93%
1 Jan 1994 Jahr
1.139 Trln
+19.237 Mlrd.
1.72%
1 Jan 1995 Jahr
1.187 Trln
+47.587 Mlrd.
4.18%
1 Jan 1996 Jahr
1.251 Trln
+64.006 Mlrd.
5.39%
1 Jan 1997 Jahr
1.293 Trln
+42.771 Mlrd.
3.42%
1 Jan 1998 Jahr
1.348 Trln
+54.543 Mlrd.
4.22%
1 Jan 1999 Jahr
1.41 Trln
+62.47 Mlrd.
4.63%
1 Jan 2000 Jahr
1.45 Trln
+39.948 Mlrd.
2.83%
1 Jan 2001 Jahr
1.532 Trln
+81.344 Mlrd.
5.61%
1 Jan 2002 Jahr
1.59 Trln
+58.187 Mlrd.
3.8%
1 Jan 2003 Jahr
1.626 Trln
+36.6 Mlrd.
2.3%
1 Jan 2004 Jahr
1.658 Trln
+31.537 Mlrd.
1.94%
1 Jan 2005 Jahr
1.696 Trln
+38.378 Mlrd.
2.31%
1 Jan 2006 Jahr
1.744 Trln
+47.531 Mlrd.
2.8%
1 Jan 2007 Jahr
1.887 Trln
+143.258 Mlrd.
8.21%
1 Jan 2008 Jahr
1.986 Trln
+99.023 Mlrd.
5.25%
1 Jan 2009 Jahr
2.062 Trln
+76.304 Mlrd.
3.84%
1 Jan 2010 Jahr
2.039 Trln
-23.114 Mlrd.
-1.12%
1 Jan 2011 Jahr
2.074 Trln
+34.411 Mlrd.
1.69%
1 Jan 2012 Jahr
2.151 Trln
+77.309 Mlrd.
3.73%
1 Jan 2013 Jahr
2.153 Trln
+1.949 Mlrd.
0.09%
1 Jan 2014 Jahr
2.173 Trln
+19.84 Mlrd.
0.92%
1 Jan 2015 Jahr
2.193 Trln
+19.905 Mlrd.
0.92%
1 Jan 2016 Jahr
2.249 Trln
+56.326 Mlrd.
2.57%

Bewertung der Länder gemäß mit laufender Statistik nach Jahren