33
/de/
AIzaSyB4mHJ5NPEv-XzF7P6NDYXjlkCWaeKw5bc
November 1, 2025
286345
Zambia
ZMB
true
2
1
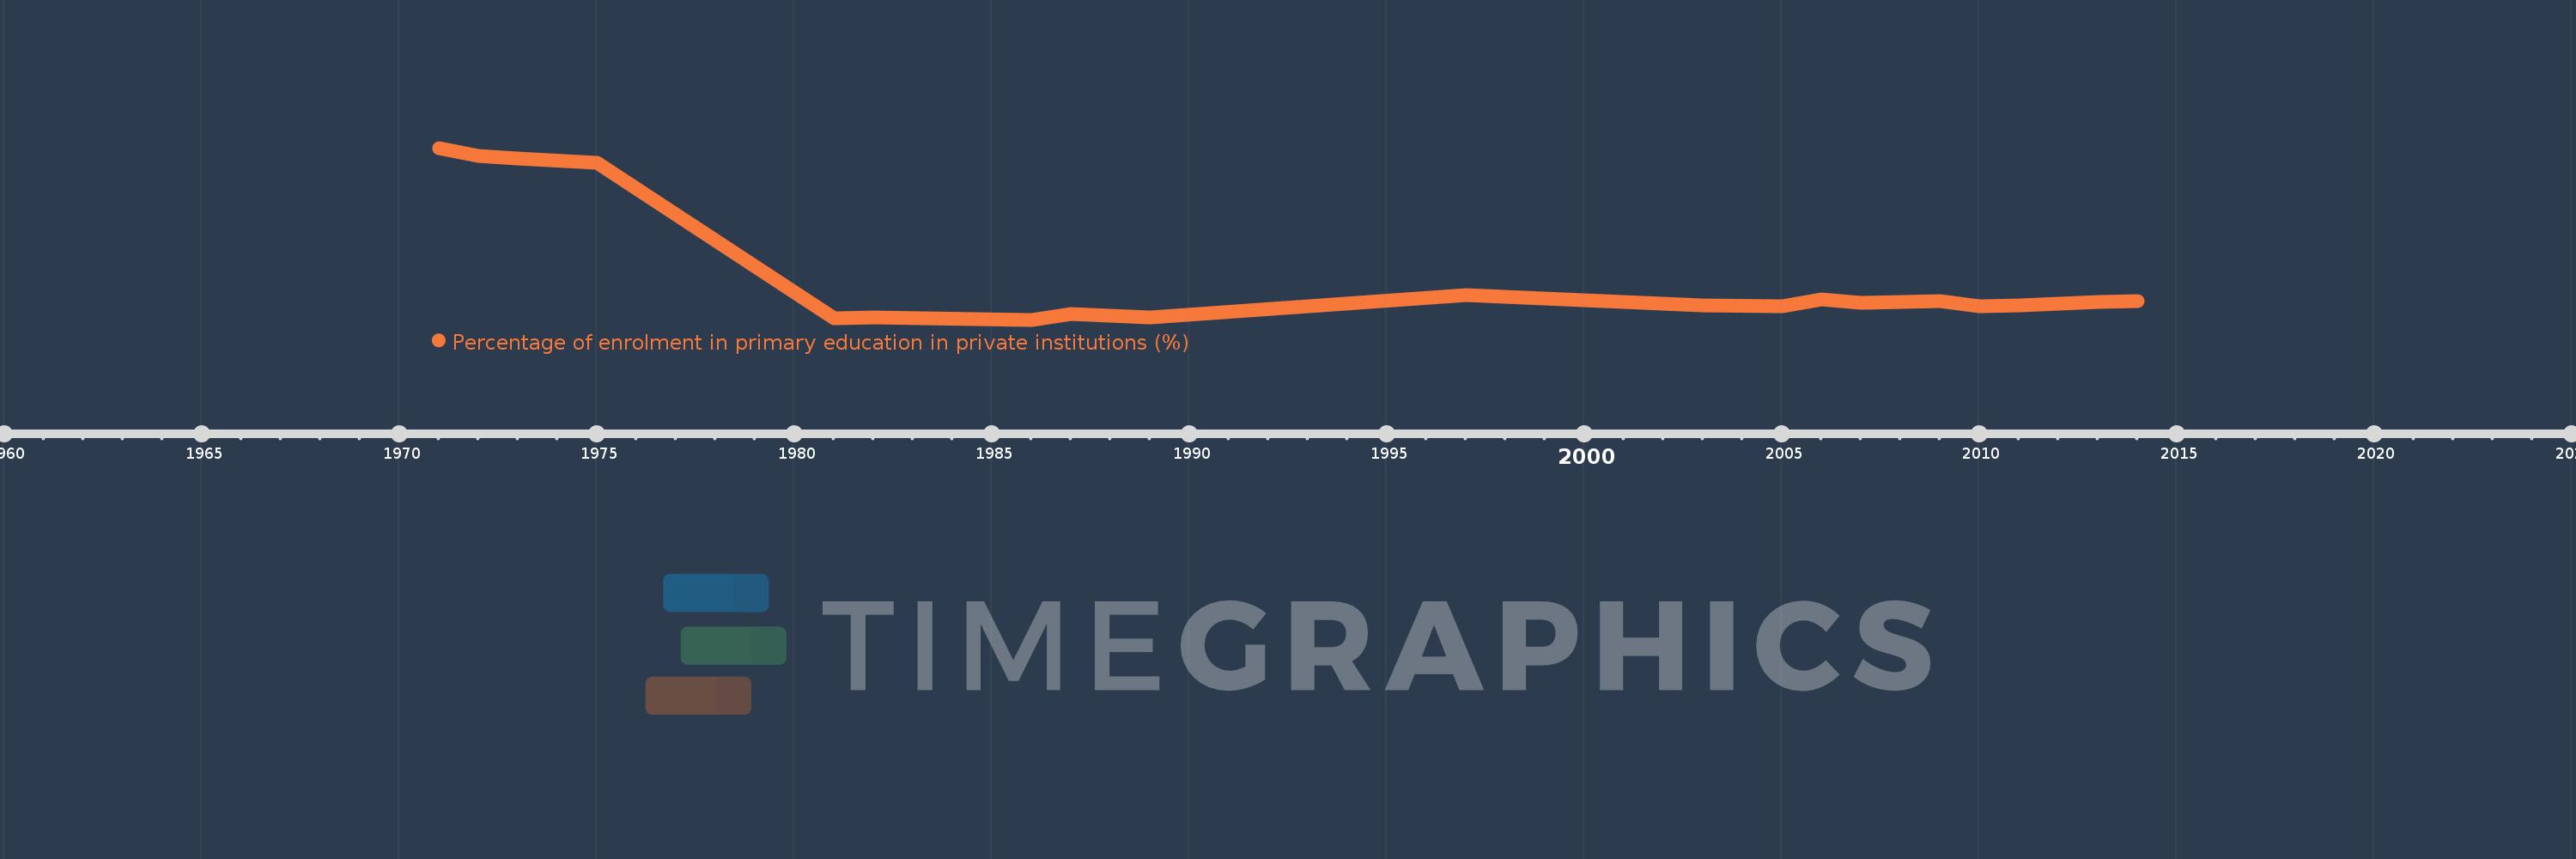
Percentage of enrolment in primary education in private institutions (%)
2014,2013,2012,2011,2010,2009,2008,2007,2006,2005,2003,1997,1989,1987,1986,1982,1981,1975,1973,1972,1971