33
/de/
AIzaSyB4mHJ5NPEv-XzF7P6NDYXjlkCWaeKw5bc
November 30, 2025
182439
Luxembourg
LUX
true
2
1
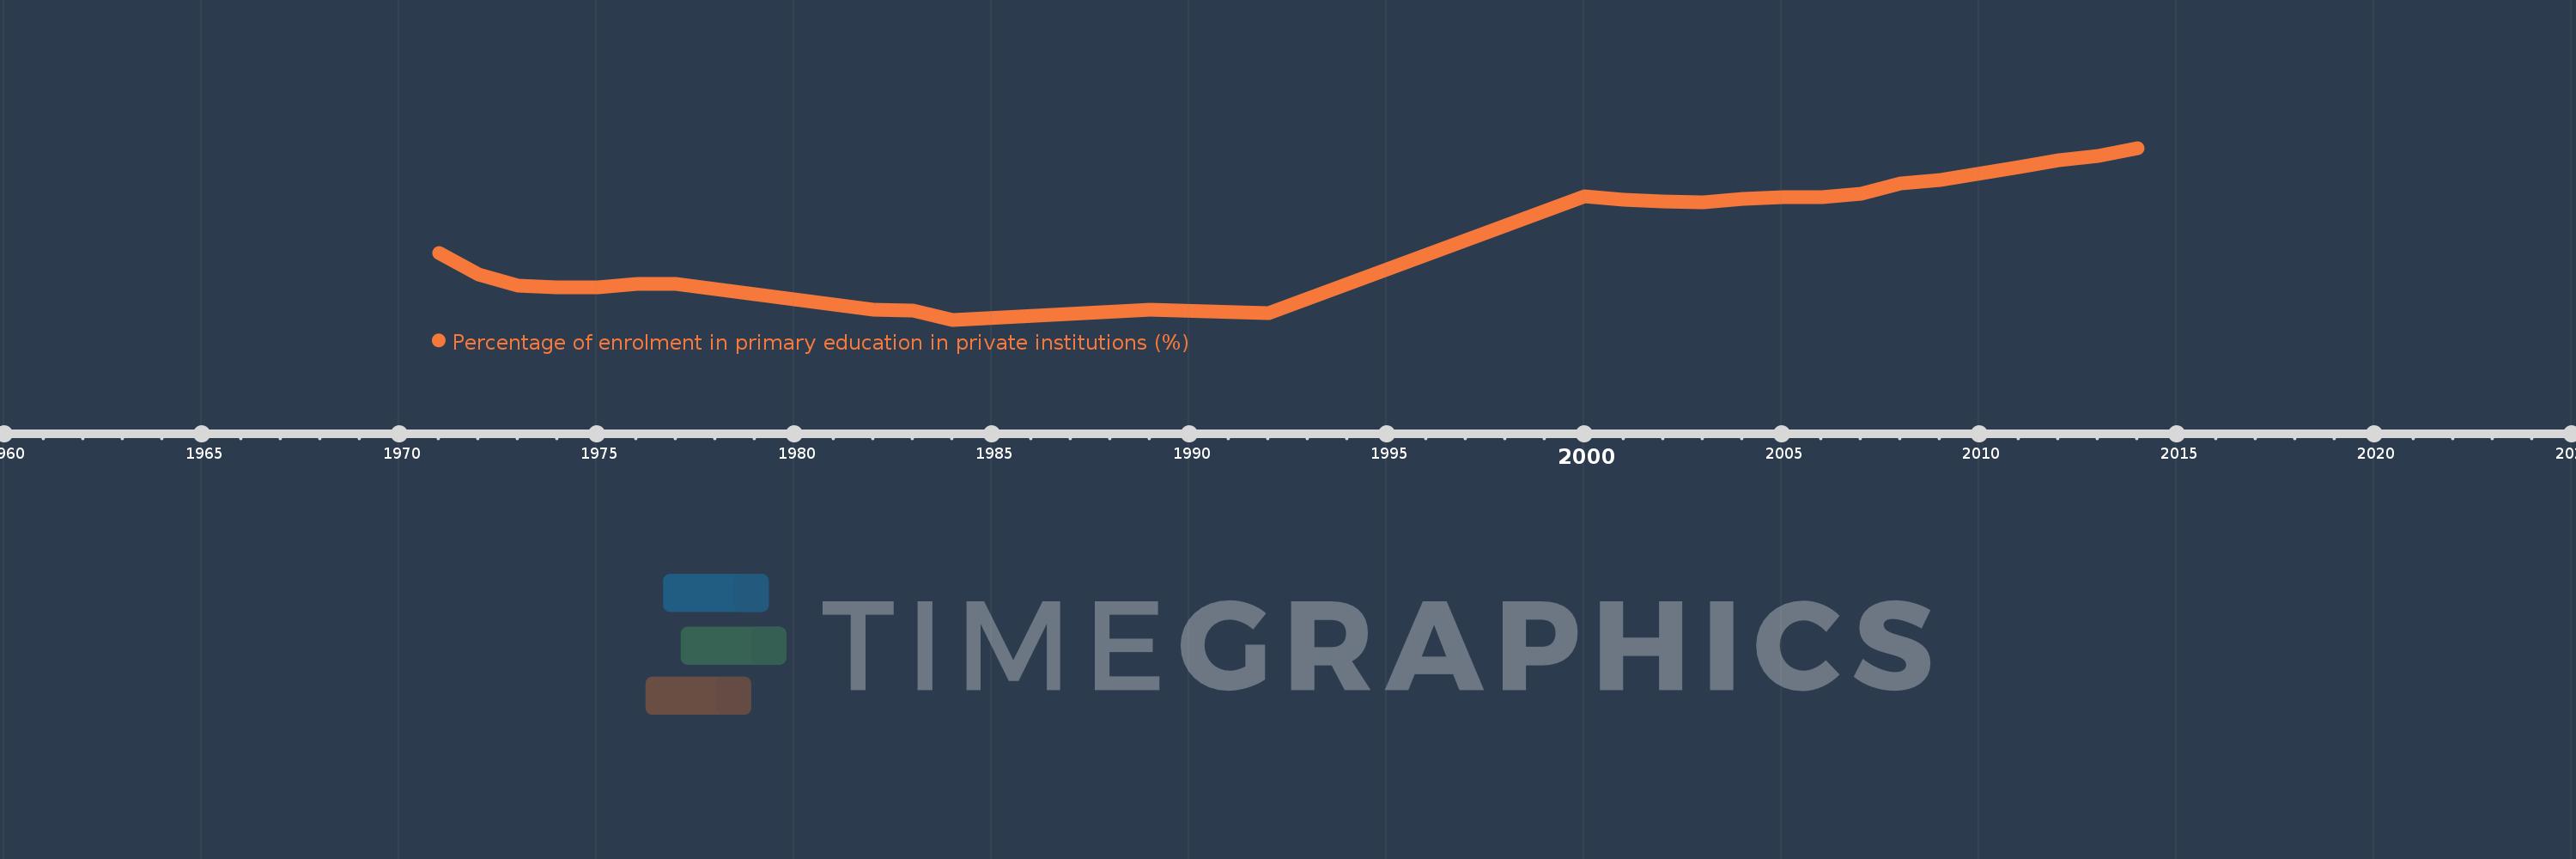
Percentage of enrolment in primary education in private institutions (%)
2014,2013,2012,2011,2009,2008,2007,2006,2005,2004,2003,2002,2001,2000,1992,1989,1984,1983,1982,1978,1977,1976,1975,1974,1973,1972,1971