33
/de/
AIzaSyB4mHJ5NPEv-XzF7P6NDYXjlkCWaeKw5bc
November 30, 2025
121323
Dominica
DMA
true
2
1
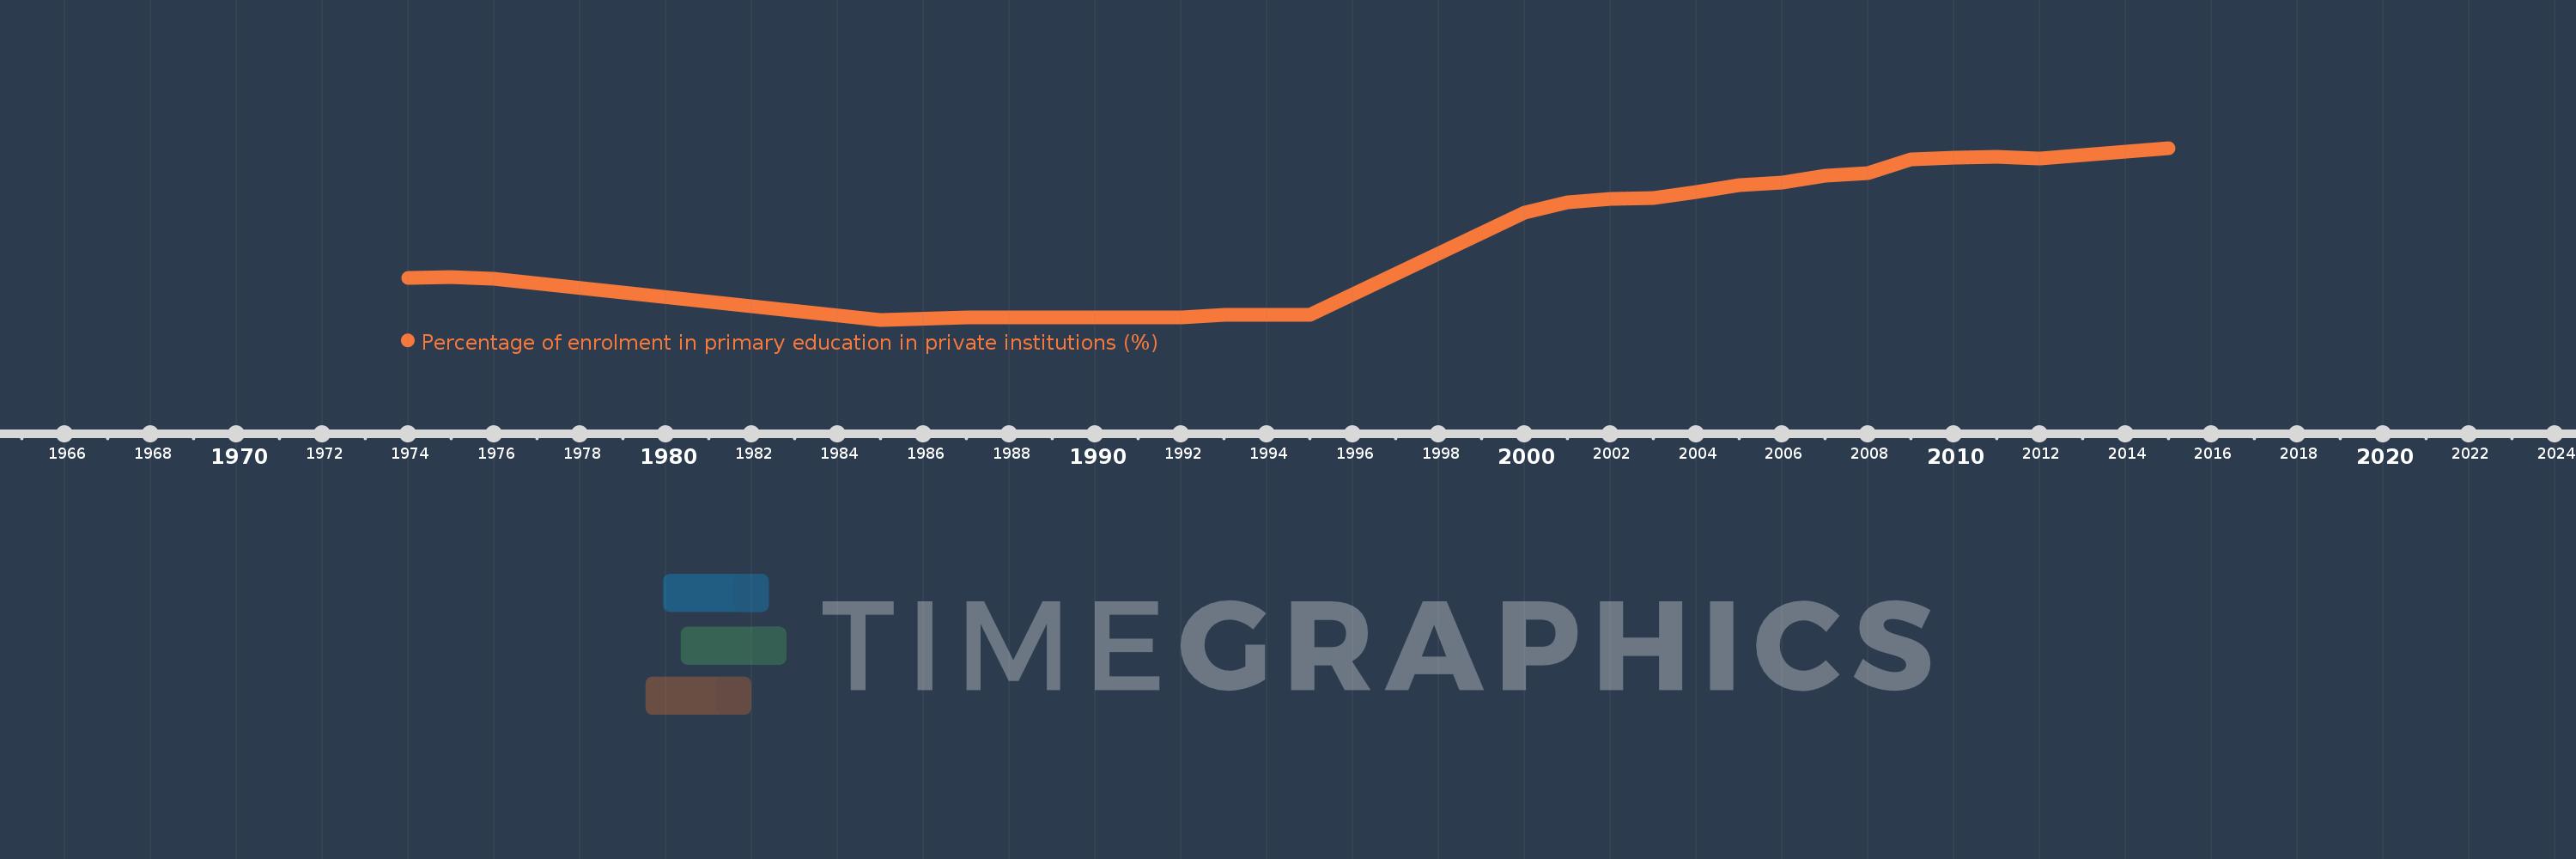
Percentage of enrolment in primary education in private institutions (%)
2015,2013,2012,2011,2010,2009,2008,2007,2006,2005,2004,2003,2002,2001,2000,1995,1993,1992,1987,1985,1976,1975,1974