29
/de/
de
AIzaSyAYiBZKx7MnpbEhh9jyipgxe19OcubqV5w
April 1, 2024
276949
United States
USA
true
2
1
Net intake rate in grade 1, female (% of official school-age population)
2015,2014,2011,2010,2009,2008,2007,2006,2005,2004,2003
Download
Bibliothek der Globalstatistik →United States →

Net intake rate in grade 1, female (% of official school-age population)

Diese Statistik in anderen Ländern:
AfghanistanAlbaniaAlgeriaAngolaAntigua and BarbudaArab WorldArmeniaArubaAzerbaijanBahamas, TheBahrainBangladeshBarbadosBelarusBelizeBeninBermudaBhutanBoliviaBosnia and HerzegovinaBotswanaBrunei DarussalamBulgariaBurkina FasoBurundiCabo VerdeCambodiaCameroonCaribbean small statesCentral African RepublicChadChileColombiaComorosCongo, Dem. Rep.Congo, Rep.Costa RicaCote d'IvoireCroatiaCubaCyprusDenmarkDjiboutiDominicaDominican RepublicEarly-demographic dividendEast Asia & PacificEcuadorEgypt, Arab Rep.El SalvadorEquatorial GuineaEritreaEstoniaEthiopiaEuro areaEurope & Central AsiaEurope & Central Asia (excluding high income)Europe & Central Asia (IDA & IBRD countries)FijiFragile and conflict affected situationsGambia, TheGeorgiaGhanaGreeceGrenadaGuatemalaGuineaGuinea-BissauGuyanaHeavily indebted poor countries (HIPC)High incomeHondurasIcelandIDA & IBRD totalIDA onlyIDA totalIndonesiaIran, Islamic Rep.IraqIrelandItalyJapanJordanKazakhstanKenyaKorea, Dem. People’s Rep.Korea, Rep.KuwaitKyrgyz RepublicLao PDRLatin America & Caribbean Latin America & Caribbean (excluding high income)Latin America & the Caribbean (IDA & IBRD countries)Least developed countries: UN classificationLebanonLesothoLiberiaLiechtensteinLithuaniaLow & middle incomeLow incomeLuxembourgMacedonia, FYRMadagascarMalawiMaldivesMaliMaltaMarshall IslandsMauritaniaMauritiusMexicoMicronesia, Fed. Sts.Middle East & North AfricaMiddle East & North Africa (excluding high income)Middle East & North Africa (IDA & IBRD countries)MoldovaMongoliaMontenegroMoroccoMozambiqueNamibiaNauruNepalNicaraguaNigerNorth AmericaNorwayOECD membersOmanOther small statesPacific island small statesParaguayPeruPhilippinesPortugalPost-demographic dividendPre-demographic dividendPuerto RicoQatarRomaniaRwandaSamoaSan MarinoSao Tome and PrincipeSaudi ArabiaSenegalSerbiaSeychellesSierra LeoneSloveniaSmall statesSolomon IslandsSouth AfricaSpainSri LankaSt. Kitts and NevisSt. LuciaSt. Vincent and the GrenadinesSub-Saharan Africa Sub-Saharan Africa (excluding high income)Sub-Saharan Africa (IDA & IBRD countries)SurinameSwazilandSwedenSwitzerlandSyrian Arab RepublicTajikistanTanzaniaThailandTimor-LesteTogoTongaTrinidad and TobagoTunisiaTurkeyUgandaUkraineUnited Arab EmiratesUnited StatesUruguayUzbekistanVanuatuVenezuela, RBWest Bank and GazaWorldYemen, Rep.ZambiaZimbabwe
Zeitlinie:
Diese Zeitleiste vorliegt die Graphik ab 2003 J. bis 2015 J. United States. Die Angaben bis 2002 J. sind nicht vorhanden. Die Zahl aktueller Beobachtungen nach Daten: 11.
Die Quelle (Bezeichnung):
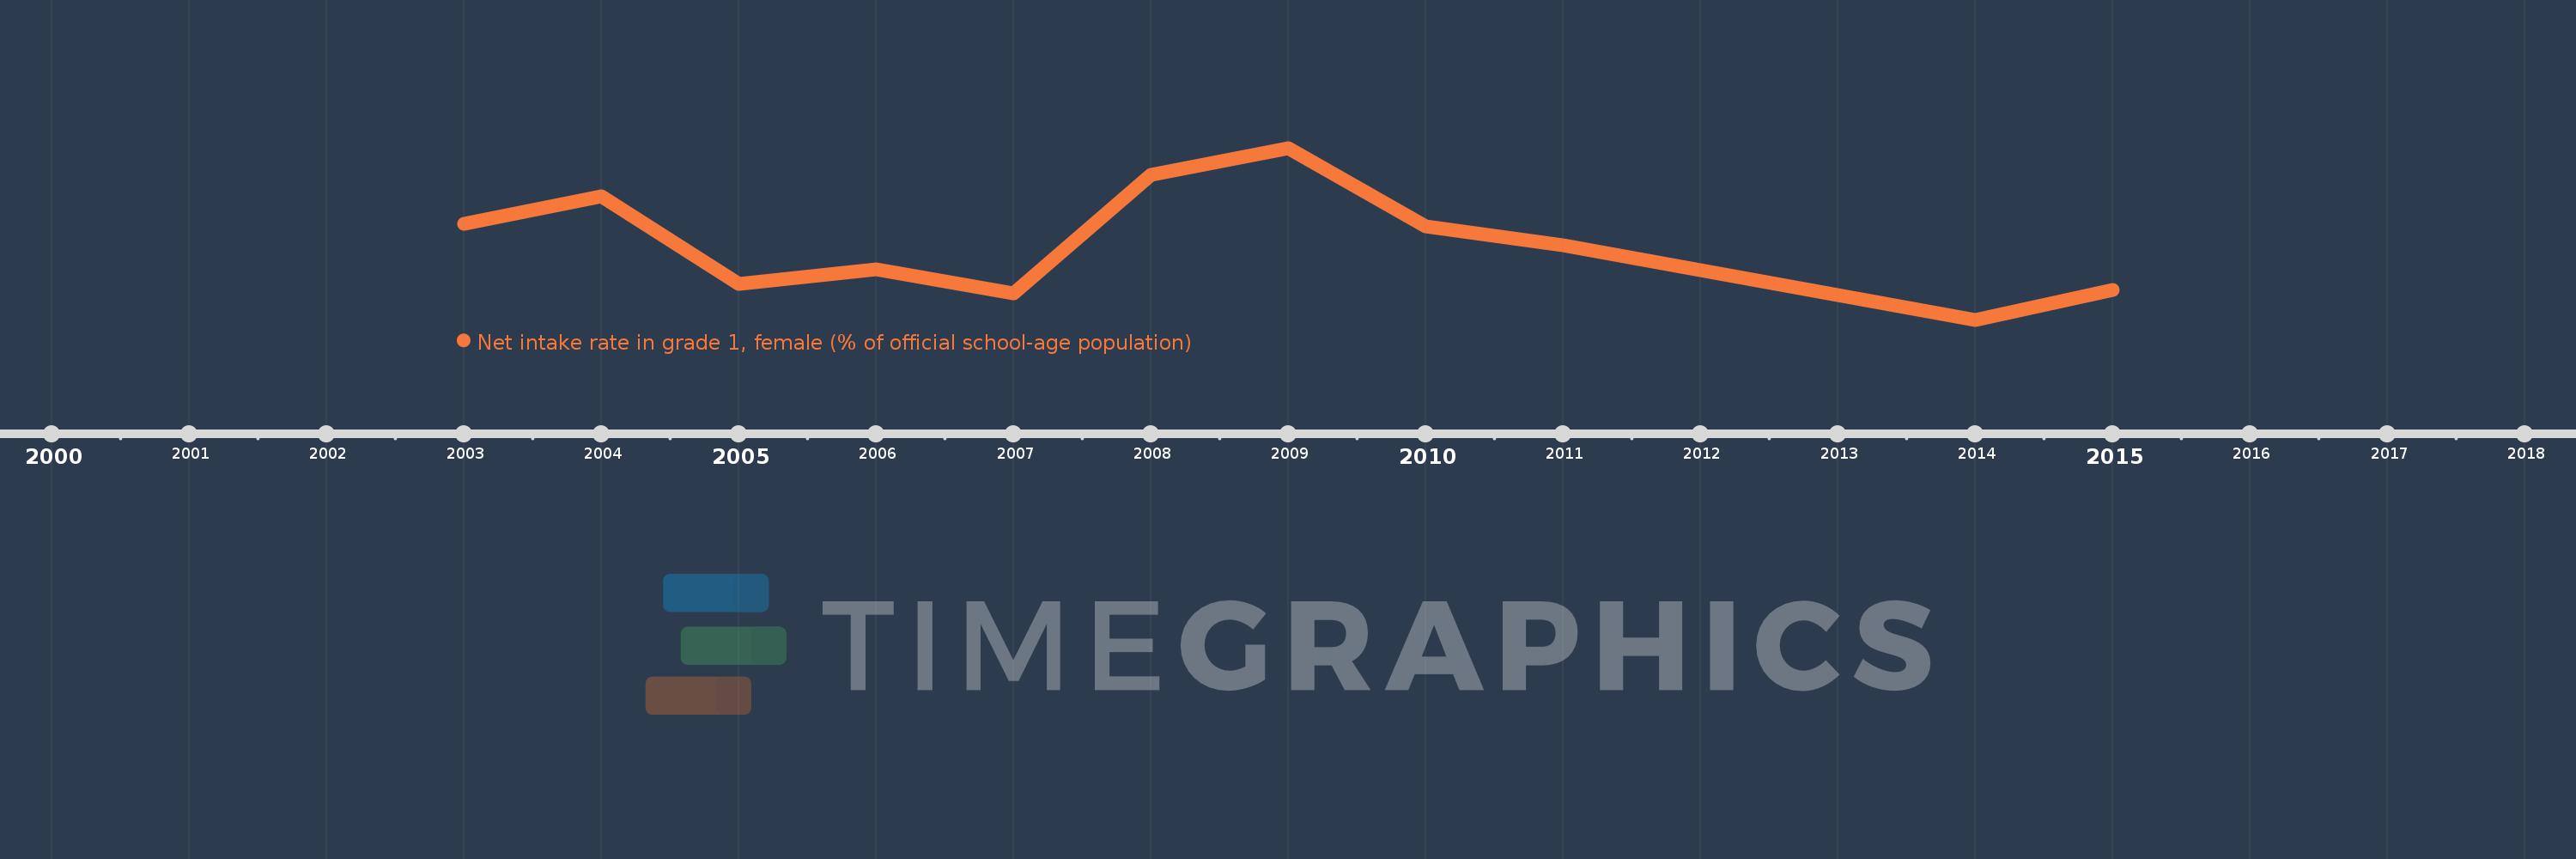
Kennzahlen der Weltentwicklung
Die Quelle (Einrichtung):
United Nations Educational, Scientific, and Cultural Organization (UNESCO) Institute for Statistics.
Kategorien:
Education, Gender
Es wurde aktualisiert:
23 Apr 2017 Jahr
Kennzahlen der Wertänderungen vom Jahr zum Jahr
im Durchschnitt:
76.943
Minimum:
72.881
1 Jan 2014 Jahr
Maximum:
81.956
1 Jan 2009 Jahr
Zum Datum der Beobachtung
Wert
Absolute Veränderung
Die Veränderung bezüglich dem vorherigen Wert
1 Jan 2003 Jahr
77.929
+77.929
0.0%
1 Jan 2004 Jahr
79.386
+1.457
1.87%
1 Jan 2005 Jahr
74.77
-4.616
-5.81%
1 Jan 2006 Jahr
75.558
+0.788
1.05%
1 Jan 2007 Jahr
74.263
-1.295
-1.71%
1 Jan 2008 Jahr
80.544
+6.281
8.46%
1 Jan 2009 Jahr
81.956
+1.412
1.75%
1 Jan 2010 Jahr
77.818
-4.138
-5.05%
1 Jan 2011 Jahr
76.812
-1.006
-1.29%
1 Jan 2014 Jahr
72.881
-3.931
-5.12%
1 Jan 2015 Jahr
74.459
+1.577
2.16%
Bewertung der Länder gemäß mit laufender Statistik nach Jahren

Kommentare:

Abschicken
PremiumAbout & FeedbackVereinbarungPrivatheit
logo
© 2022 Selected Technologies LLC – Morgan Hill, California