29
/de/
de
AIzaSyAYiBZKx7MnpbEhh9jyipgxe19OcubqV5w
April 1, 2024
140780
Ghana
GHA
true
2
1
Net intake rate in grade 1, female (% of official school-age population)
2010,2009,2008,2007,2006,2004,2000
Download
Bibliothek der Globalstatistik →Ghana →

Net intake rate in grade 1, female (% of official school-age population)

Diese Statistik in anderen Ländern:
AfghanistanAlbaniaAlgeriaAngolaAntigua and BarbudaArab WorldArmeniaArubaAzerbaijanBahamas, TheBahrainBangladeshBarbadosBelarusBelizeBeninBermudaBhutanBoliviaBosnia and HerzegovinaBotswanaBrunei DarussalamBulgariaBurkina FasoBurundiCabo VerdeCambodiaCameroonCaribbean small statesCentral African RepublicChadChileColombiaComorosCongo, Dem. Rep.Congo, Rep.Costa RicaCote d'IvoireCroatiaCubaCyprusDenmarkDjiboutiDominicaDominican RepublicEarly-demographic dividendEast Asia & PacificEcuadorEgypt, Arab Rep.El SalvadorEquatorial GuineaEritreaEstoniaEthiopiaEuro areaEurope & Central AsiaEurope & Central Asia (excluding high income)Europe & Central Asia (IDA & IBRD countries)FijiFragile and conflict affected situationsGambia, TheGeorgiaGhanaGreeceGrenadaGuatemalaGuineaGuinea-BissauGuyanaHeavily indebted poor countries (HIPC)High incomeHondurasIcelandIDA & IBRD totalIDA onlyIDA totalIndonesiaIran, Islamic Rep.IraqIrelandItalyJapanJordanKazakhstanKenyaKorea, Dem. People’s Rep.Korea, Rep.KuwaitKyrgyz RepublicLao PDRLatin America & Caribbean Latin America & Caribbean (excluding high income)Latin America & the Caribbean (IDA & IBRD countries)Least developed countries: UN classificationLebanonLesothoLiberiaLiechtensteinLithuaniaLow & middle incomeLow incomeLuxembourgMacedonia, FYRMadagascarMalawiMaldivesMaliMaltaMarshall IslandsMauritaniaMauritiusMexicoMicronesia, Fed. Sts.Middle East & North AfricaMiddle East & North Africa (excluding high income)Middle East & North Africa (IDA & IBRD countries)MoldovaMongoliaMontenegroMoroccoMozambiqueNamibiaNauruNepalNicaraguaNigerNorth AmericaNorwayOECD membersOmanOther small statesPacific island small statesParaguayPeruPhilippinesPortugalPost-demographic dividendPre-demographic dividendPuerto RicoQatarRomaniaRwandaSamoaSan MarinoSao Tome and PrincipeSaudi ArabiaSenegalSerbiaSeychellesSierra LeoneSloveniaSmall statesSolomon IslandsSouth AfricaSpainSri LankaSt. Kitts and NevisSt. LuciaSt. Vincent and the GrenadinesSub-Saharan Africa Sub-Saharan Africa (excluding high income)Sub-Saharan Africa (IDA & IBRD countries)SurinameSwazilandSwedenSwitzerlandSyrian Arab RepublicTajikistanTanzaniaThailandTimor-LesteTogoTongaTrinidad and TobagoTunisiaTurkeyUgandaUkraineUnited Arab EmiratesUnited StatesUruguayUzbekistanVanuatuVenezuela, RBWest Bank and GazaWorldYemen, Rep.ZambiaZimbabwe
Zeitlinie:
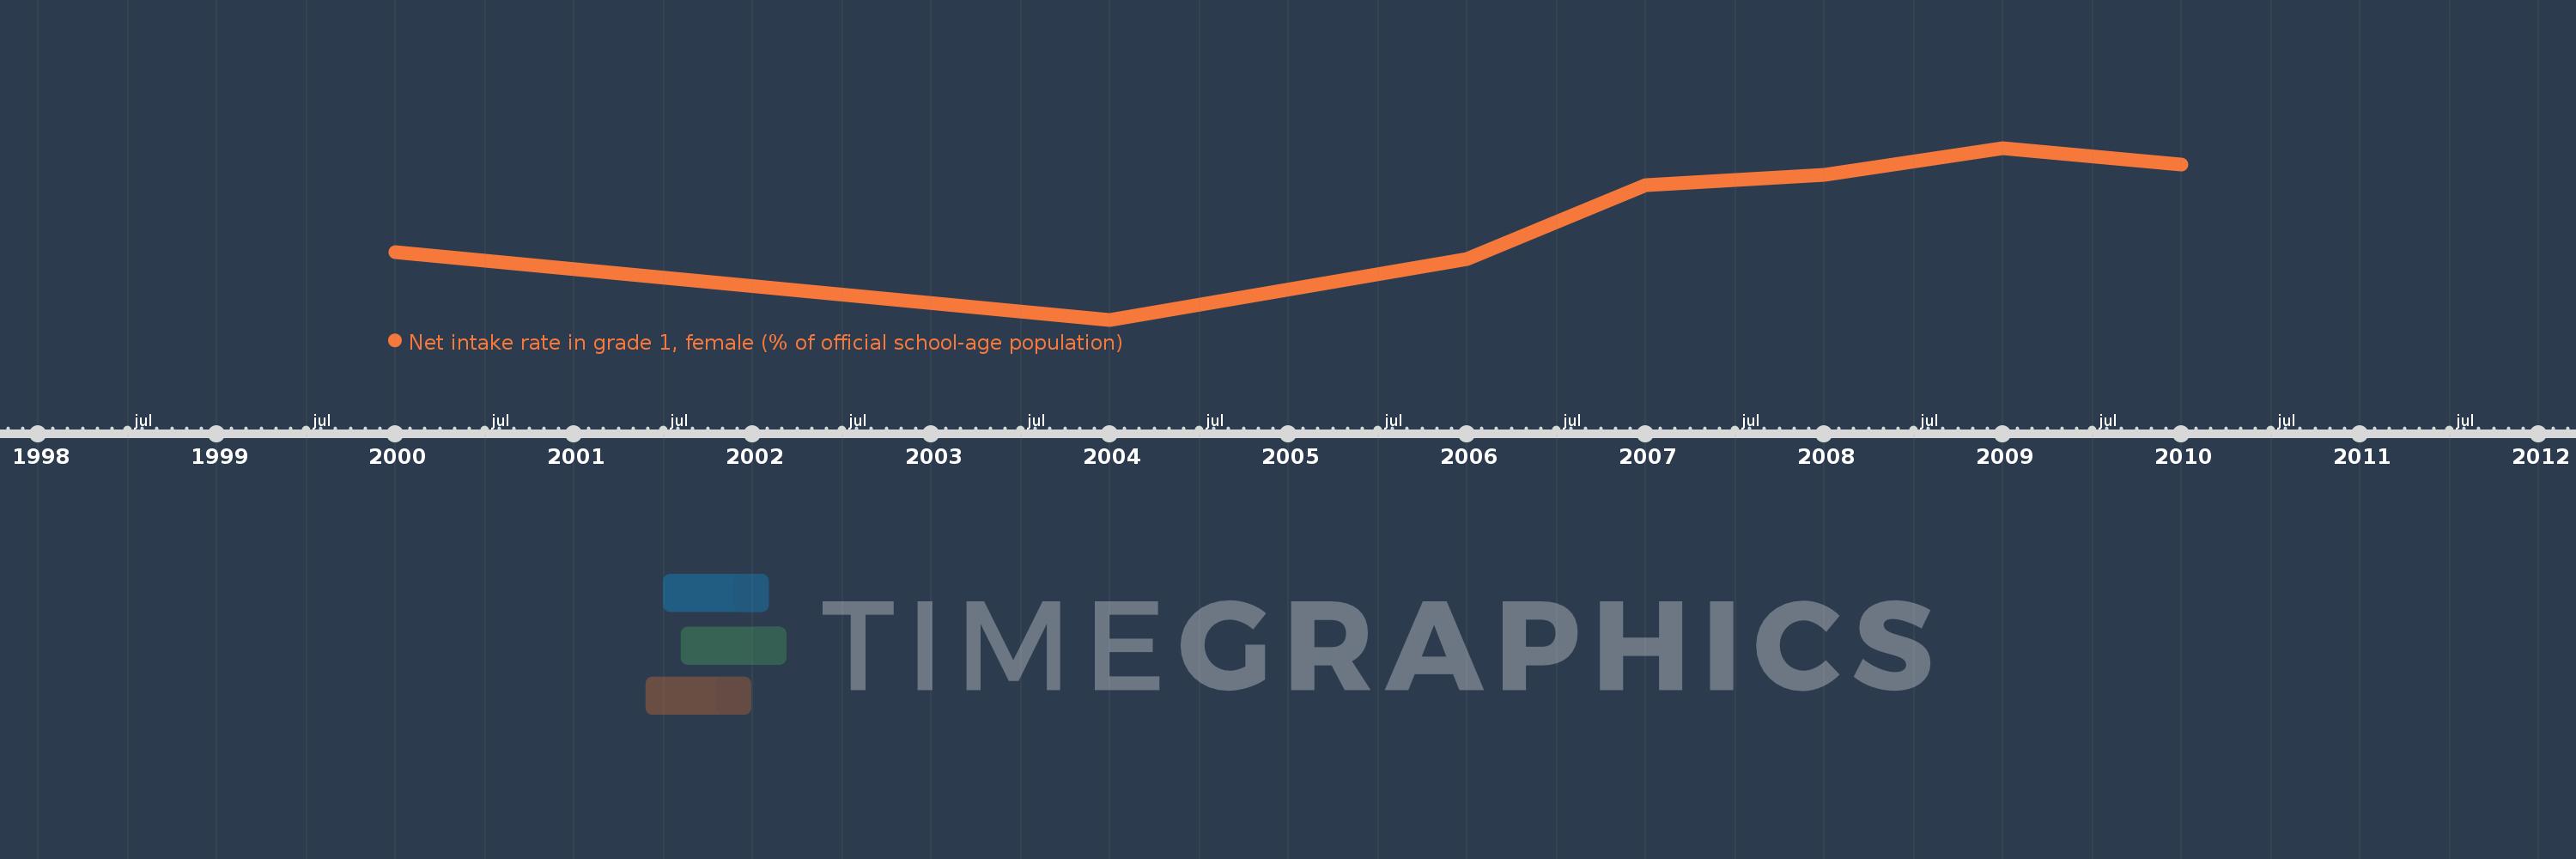
Diese Zeitleiste vorliegt die Graphik ab 2000 J. bis 2010 J. Ghana. Die Angaben bis 1999 J. sind nicht vorhanden. Die Zahl aktueller Beobachtungen nach Daten: 7.
Die Quelle (Bezeichnung):
Kennzahlen der Weltentwicklung
Die Quelle (Einrichtung):
United Nations Educational, Scientific, and Cultural Organization (UNESCO) Institute for Statistics.
Kategorien:
Education, Gender
Es wurde aktualisiert:
23 Apr 2017 Jahr
Kennzahlen der Wertänderungen vom Jahr zum Jahr
im Durchschnitt:
34.378
Minimum:
24.446
1 Jan 2004 Jahr
Maximum:
40.693
1 Jan 2009 Jahr
Zum Datum der Beobachtung
Wert
Absolute Veränderung
Die Veränderung bezüglich dem vorherigen Wert
1 Jan 2000 Jahr
30.823
+30.823
0.0%
1 Jan 2004 Jahr
24.446
-6.376
-20.69%
1 Jan 2006 Jahr
30.203
+5.757
23.55%
1 Jan 2007 Jahr
37.188
+6.984
23.12%
1 Jan 2008 Jahr
38.185
+0.997
2.68%
1 Jan 2009 Jahr
40.693
+2.508
6.57%
1 Jan 2010 Jahr
39.11
-1.584
-3.89%
Bewertung der Länder gemäß mit laufender Statistik nach Jahren

Kommentare:

Abschicken
PremiumAbout & FeedbackVereinbarungPrivatheit
logo
© 2022 Selected Technologies LLC – Morgan Hill, California