33
/de/
AIzaSyAYiBZKx7MnpbEhh9jyipgxe19OcubqV5w
August 1, 2025
273931
Ukraine
UKR
true
2
1
Net bilateral aid flows from DAC donors, Ireland (current US$)
2015,2013,2012,2010,2009,2008,2007,2006,2005,1998,1997
Download
Bibliothek der Globalstatistik →Ukraine →

Net bilateral aid flows from DAC donors, Ireland (current US$)

Diese Statistik in anderen Ländern:

AfghanistanAlbaniaAlgeriaAngolaArab WorldArgentinaArmeniaAzerbaijanBangladeshBelarusBelizeBeninBhutanBoliviaBosnia and HerzegovinaBotswanaBrazilBulgariaBurkina FasoBurundiCambodiaCameroonCaribbean small statesCentral African RepublicCentral Europe and the BalticsChadChileChinaColombiaComorosCongo, Dem. Rep.Congo, Rep.Costa RicaCote d'IvoireCroatiaCubaCzech RepublicDjiboutiDominican RepublicEast Asia & PacificEast Asia & Pacific (excluding high income)East Asia & Pacific (IDA & IBRD countries)EcuadorEgypt, Arab Rep.El SalvadorEquatorial GuineaEritreaEthiopiaEuro areaEurope & Central AsiaEurope & Central Asia (excluding high income)Europe & Central Asia (IDA & IBRD countries)European UnionFijiFragile and conflict affected situationsGabonGambia, TheGeorgiaGhanaGrenadaGuatemalaGuineaGuinea-BissauGuyanaHaitiHeavily indebted poor countries (HIPC)High incomeHondurasHong Kong SAR, ChinaHungaryIBRD onlyIDA & IBRD totalIDA blendIDA onlyIDA totalIndiaIndonesiaIran, Islamic Rep.IraqIsraelJamaicaJordanKazakhstanKenyaKorea, Dem. People’s Rep.Korea, Rep.KosovoKyrgyz RepublicLao PDRLatin America & Caribbean Latin America & Caribbean (excluding high income)Latin America & the Caribbean (IDA & IBRD countries)LatviaLeast developed countries: UN classificationLebanonLesothoLiberiaLibyaLithuaniaLow & middle incomeLow incomeLower middle incomeMacedonia, FYRMadagascarMalawiMalaysiaMaldivesMaliMauritaniaMauritiusMexicoMicronesia, Fed. Sts.Middle East & North AfricaMiddle East & North Africa (excluding high income)Middle East & North Africa (IDA & IBRD countries)Middle incomeMoldovaMongoliaMontenegroMoroccoMozambiqueMyanmarNamibiaNepalNicaraguaNigerNigeriaOECD membersOther small statesPacific island small statesPakistanPanamaPapua New GuineaParaguayPeruPhilippinesPolandRomaniaRussian FederationRwandaSamoaSao Tome and PrincipeSenegalSerbiaSeychellesSierra LeoneSlovak RepublicSloveniaSmall statesSolomon IslandsSomaliaSouth AfricaSouth AsiaSouth Asia (IDA & IBRD)South SudanSri LankaSt. LuciaSub-Saharan Africa Sub-Saharan Africa (excluding high income)Sub-Saharan Africa (IDA & IBRD countries)SudanSurinameSwazilandSyrian Arab RepublicTajikistanTanzaniaThailandTimor-LesteTogoTrinidad and TobagoTunisiaTurkeyTurkmenistanUgandaUkraineUpper middle incomeUruguayUzbekistanVanuatuVenezuela, RBVietnamWest Bank and GazaWorldYemen, Rep.ZambiaZimbabwe

Zeitlinie:

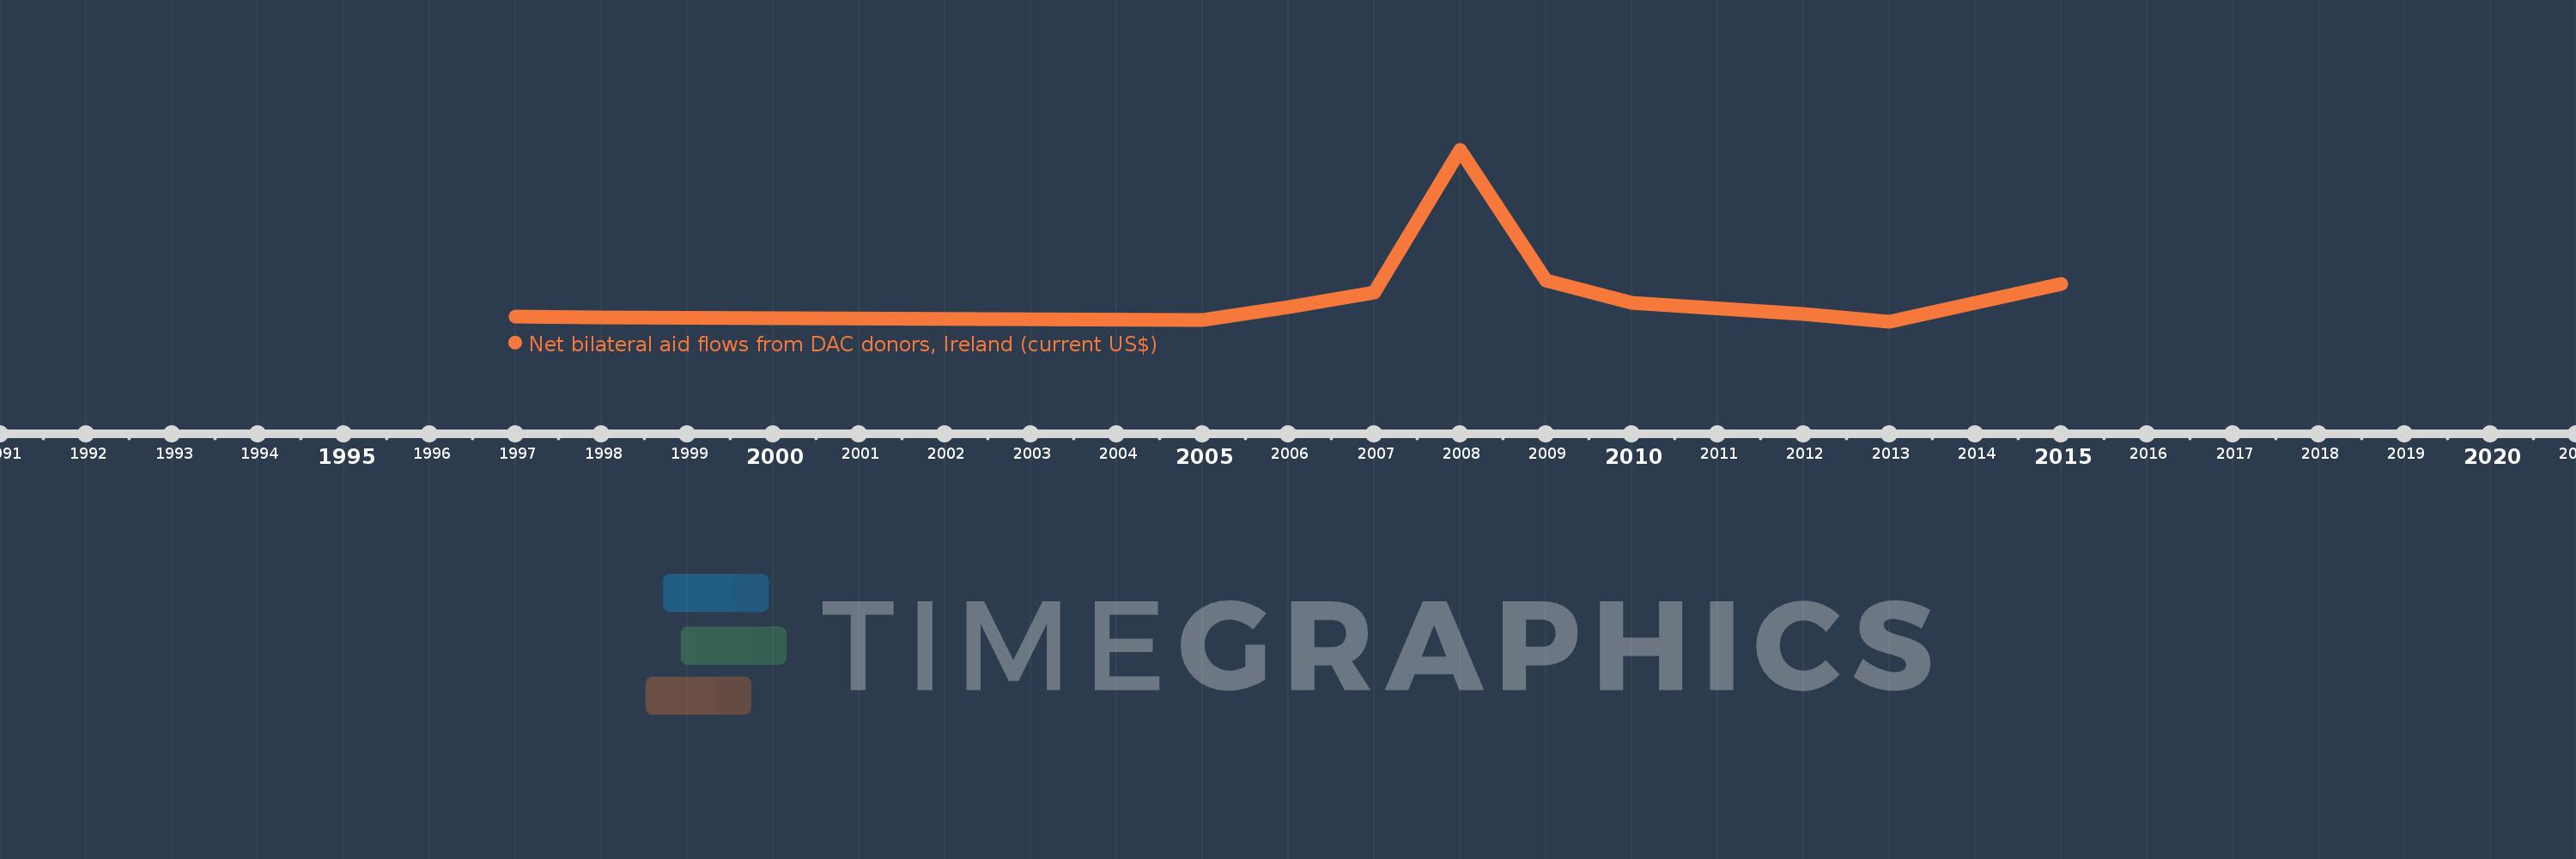
Diese Zeitleiste vorliegt die Graphik ab 1997 J. bis 2015 J. Ukraine. Die Angaben bis 1996 J. sind nicht vorhanden. Die Zahl aktueller Beobachtungen nach Daten: 11.

Die Quelle (Bezeichnung):

Kennzahlen der Weltentwicklung

Die Quelle (Einrichtung):

Development Assistance Committee of the Organisation for Economic Co-operation and Development, Geographical Distribution of Financial Flows to Developing Countries, Development Co-operation Report, and International Development Statistics database. Data are available online at: www.oecd.org/dac/stats/idsonline.

Kategorien:

Aid Effectiveness

Es wurde aktualisiert:

23 Apr 2017 Jahr

Kennzahlen der Wertänderungen vom Jahr zum Jahr

im Durchschnitt:
340.0 Tsnd.
Minimum:
10.0 Tsnd.
1 Jan 2013 Jahr
Maximum:
1.87 Mln.
1 Jan 2008 Jahr
Zum Datum der Beobachtung
Wert
Absolute Veränderung
Die Veränderung bezüglich dem vorherigen Wert
1 Jan 1997 Jahr
70.0 Tsnd.
+70.0 Tsnd.
0.0%
1 Jan 1998 Jahr
60.0 Tsnd.
-10.0 Tsnd.
-14.29%
1 Jan 2005 Jahr
30.0 Tsnd.
-30.0 Tsnd.
-50.0%
1 Jan 2006 Jahr
170.0 Tsnd.
+140.0 Tsnd.
466.67%
1 Jan 2007 Jahr
330.0 Tsnd.
+160.0 Tsnd.
94.12%
1 Jan 2008 Jahr
1.87 Mln.
+1.54 Mln.
466.67%
1 Jan 2009 Jahr
460.0 Tsnd.
-1.41 Mln.
-75.4%
1 Jan 2010 Jahr
220.0 Tsnd.
-240.0 Tsnd.
-52.17%
1 Jan 2012 Jahr
100.0 Tsnd.
-120.0 Tsnd.
-54.55%
1 Jan 2013 Jahr
10.0 Tsnd.
-90.0 Tsnd.
-90.0%
1 Jan 2015 Jahr
420.0 Tsnd.
+410.0 Tsnd.
4.1 Tsnd.%

Bewertung der Länder gemäß mit laufender Statistik nach Jahren